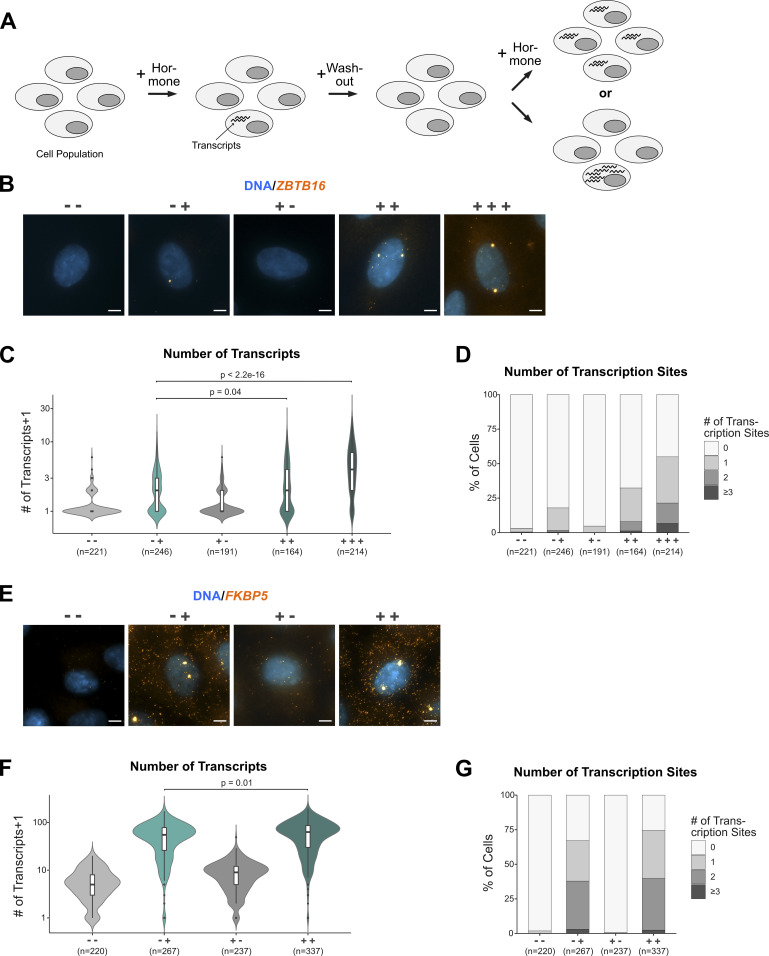
Figure 6. Single-cell analysis comparing the activation of the ZBTB16 gene between “primed” and “naïve” cells.
(A) Cartoon depicting how a more robust response can be driven by both more cells responding and by individual cells that respond more robustly. (B) Representative image of an RNA FISH experiment targeting ZBTB16 mRNA (orange) in A549 cells. Nuclei were counterstained with DAPI (blue). Cells were hormone treated before fixation as described in Fig 3A. Scale bar 5 μm. (C) Violin plots with box plots inside showing the number of ZBTB16 transcripts + 1 per cell as detected by RNA FISH for treatments as in (B). Results derived from three biological replicates are shown. P-values were calculated using a two-tailed t test. (D) Stacked bar graphs showing the percentage of cells with 0, 1, 2, or ≥3 visible transcription sites of ZBTB16 per treatment in (B) as detected by RNA FISH. Results from three biological replicates are shown. (E) Same as (B), except that FKBP5 mRNA was targeted. (F). Same as (C), except that FKBP5 mRNA was targeted. (G) Same as (D), except that FKBP5 mRNA was targeted.

