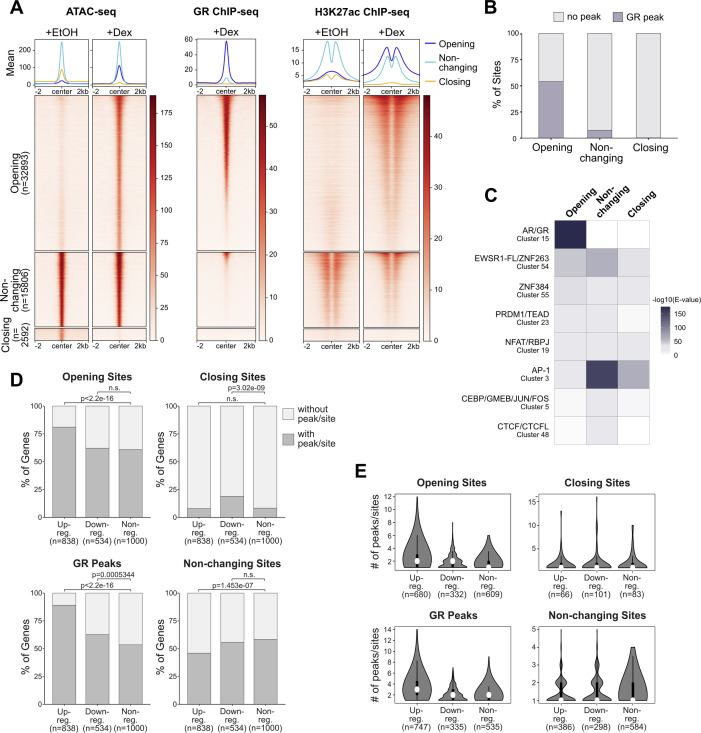
Figure S2. Genome-wide changes in chromatin accessibility in U2OS-glucocorticoid receptor (GR) cells upon GR activation.
(A) Heat map visualization and mean signal plot of ATAC-seq (normalized), GR ChIP-seq (RPKM-normalized; 1 μM Dex, 1.5 h; data from reference 65) and H3K27ac ChIP-seq (RPKM-normalized; 1 μM Dex or EtOH, 1.5 h; data from reference 66) read coverage in U2OS-GR cells at sites of increasing (“opening”), non-changing (“non-changing”) and decreasing (“closing”) chromatin accessibility upon hormone treatment (±2 kb around center). Heat maps are sorted by GR ChIP-seq signal in descending order. For ATAC-seq, cells were treated with EtOH (4 h) or Dex (100 nM, 4 h). (B) Stacked bar graphs showing the percentage of opening, non-changing, and closing sites with a GR ChIP-seq peak. GR peaks represent the intersect of peaks called in both replicates (data from references 41 and 65). (C) Heat map visualization of enriched motif clusters (from JASPAR 2018 CORE Vertebrates Clustering motifs) at all closing sites or at an equal number of randomly sampled opening or non-changing sites (±250 bp around the peak center). Shuffled input sequences were used as background for the motif enrichment analysis. Motifs were included if the E-value was <10−30 for either opening, non-changing, or closing sites. (D) Stacked bar graphs showing the percentage of genes in U2OS-GR cells of each category (up-regulated, down-regulated, and nonregulated) that have at least one peak/site for each type as indicated (opening, closing, and non-changing sites and GR peaks) within ±50 kb around the transcription start site (TSS). GR peaks represent the intersect of peaks called in both replicates (data from references 41 and 65). P-values were calculated using a Fisher’s exact test. n.s., not significant. (E) Violin plots with box plots inside showing the number of peaks/sites for each type (opening, closing, and non-changing sites and GR peaks) within ±50 kb around the TSS of genes (up-regulated, down-regulated, and nonregulated). Only genes which were found to have at least one peak/site within ±50 kb around the TSS (as shown in [D]) were included.

