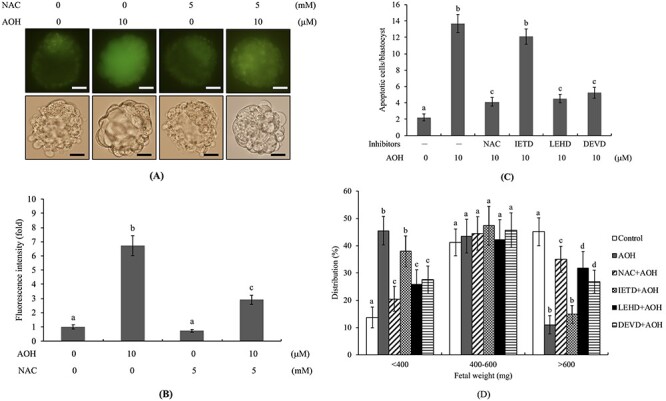
Figure 5.

Effects of NAC and caspase inhibitors on developmental status of AOH-treated embryos. Mouse blastocysts were pre-treated with 5 mM N-acetyl cysteine (NAC), 300 μM Z-IETD-FMK (IETD), 300 μM Z-LEHD-FMK (LEHD) or 300 μM Z-DEVD-FMK (DEVD) for 1 h or left untreated, followed by incubation with or without AOH (2.5, 5 or 10 μM) or .5% DMSO (control) for a further 24 h. (A) Detection of ROS generation with DCF-DA fluorescence dye (20 μM). (B) Quantitative analysis of intracellular ROS generation (fluorescence intensity) in each group using image J software. (C) Assessment of apoptosis via TUNEL staining. (D) Mean numbers of apoptotic (TUNEL-positive) cells per blastocyst. (E) Weight distribution of surviving fetuses on day 13 post-transfer via the embryo transfer assay as described in “Materials and Methods” and Figure 3. The percentage of surviving fetuses was analyzed via embryo transfer of AOH-pretreated (a total of 320 blastocysts transferred to 40 recipients) and control blastocysts. Different symbols indicate significant differences at P < .05. The scale bar is 20 μm.
