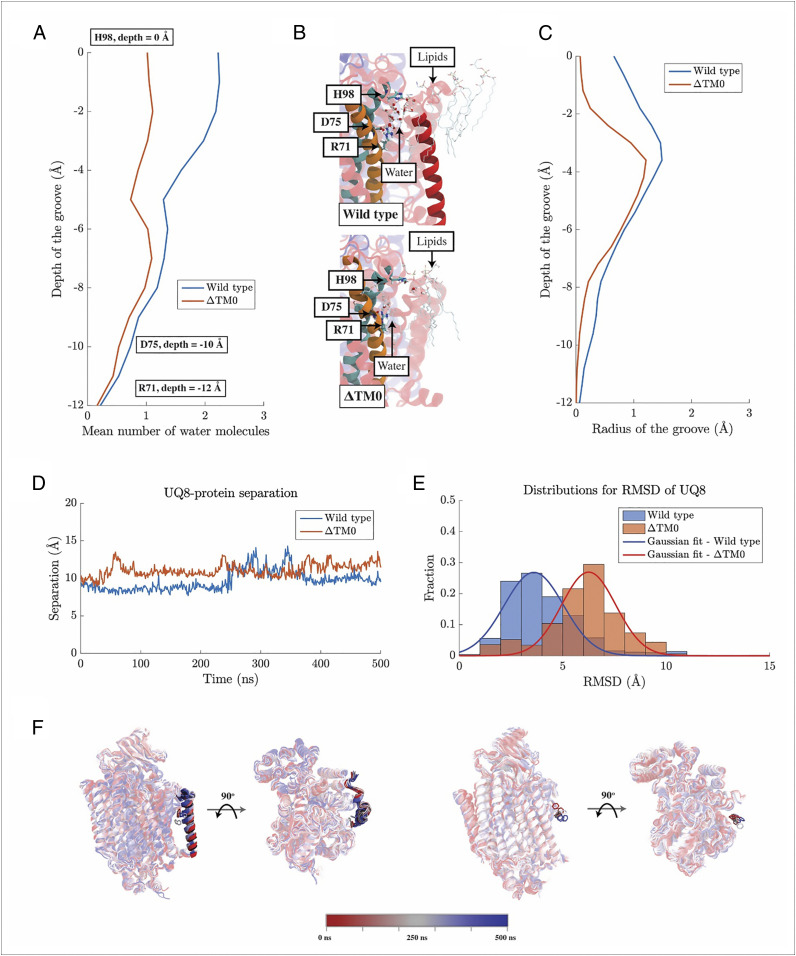
Fig. 5.
Impacts of TM0 on the function of cyt bo3. (A) The number of water molecules observed in the groove region of cyt bo3 and its mutant, ∆TM0, averaged over respective MD trajectories. (B) Molecular visualizations of water molecules in the groove region of cyt bo3 and its mutant. The groove region for the wild-type cyt bo3 is defined as the space formed among TM0 (solid red), TM1 (solid orange), and TM2 (solid cyan). For ∆TM0, this region corresponds to the water permeable space right outside TM1 and TM2. (C) Sizes of the groove regions measured by Caver. Caver uses beads with various sizes to probe the dimension of any water permeable cavity, such as the groove region of cyt bo3 here. The maximum radius found among used beads along the groove region for the wild type and that for ∆TM0 are shown here as a metric for the size of the respective groove regions. (D) Separation of the headgroup of UQ8 from cyt bo3. The separation was being measured from the center of mass of TM1. Vertical separations parallel to the membrane normal was discarded. (E) Distributions for RMSD of the headgroup of UQ8. (F) Molecular visualizations for the positions of the headgroup of UQ8. Here, snapshots along MD simulations are overlaid on one another with the coloring follows the color bar below. For clarity, only the benzene ring of UQ8 is shown.

