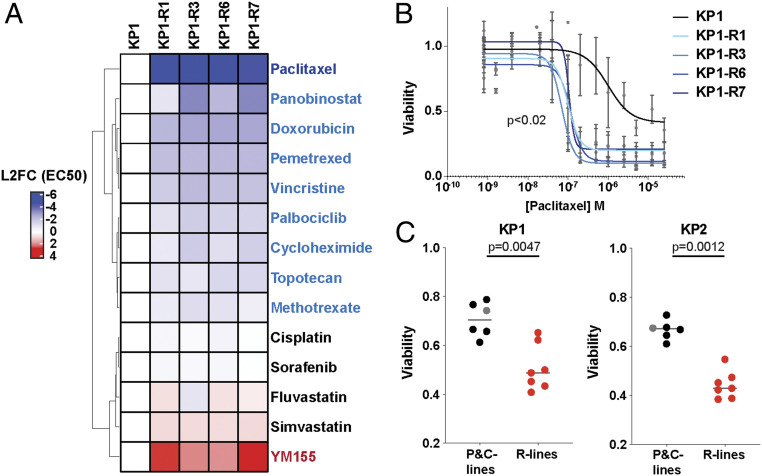
Fig. 3.
Cells resistant to PRMT5i display collateral sensitivity to paclitaxel. (A) The heatmap shows the L2FC in EC50 of KP1-R1, R3, R6, and R7 lines, relative to the KP1 control, for the indicated panel of 14 different drugs (n = 3 for each line and condition). Red is more resistant, and blue is more sensitive. (B) Graph shows the data generated by the screen of the response to paclitaxel of KP1 (black) versus KP1-R1, R3, R6, and R7 (blue) after a 5-d treatment. Viability is relative to DMSO control. Significance was determined using Welch’s t test. (C) Viability measured with resazurin after a 2-d treatment with 1 µM paclitaxel of KP1 (Left graph) or KP2 (Right graph) parental (gray), C (black; n = 5), and R cell lines (red, n = 7). For significance calculations (Mann–Whitney U test), the parental and C lines were collectively compared to the R lines.

