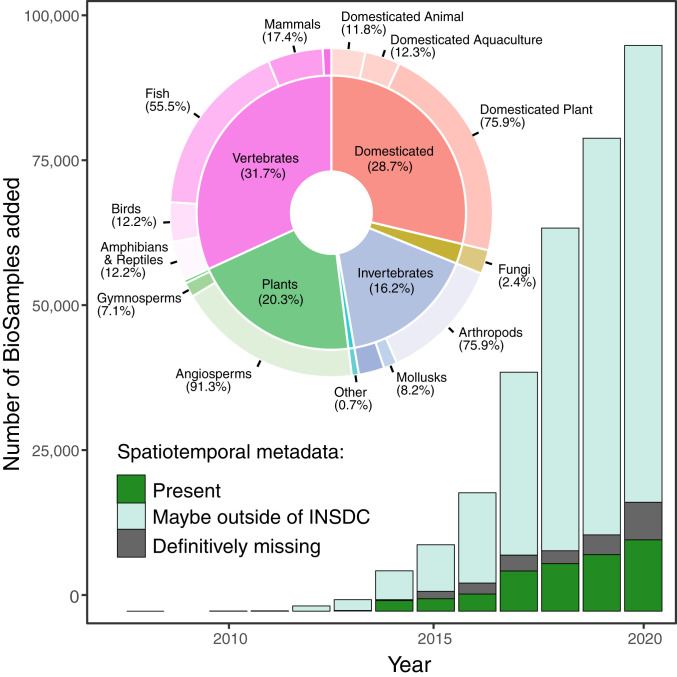
Fig. 1.
Genomic-level sequence data are being added to the INSDC at an exponential rate across eukaryotic taxa. Colors represent the status of spatiotemporal metadata (latitude/longitude and collection year) for each individual (BioSample, n = 327,577, see SI Appendix, Appendices S1–S3). (Inset) Taxonomic breakdown of BioSamples. Percentages in outer rings sum to corresponding inner-ring totals. Unlabeled inner-ring slices correspond to “other” for the outer-ring taxa.

