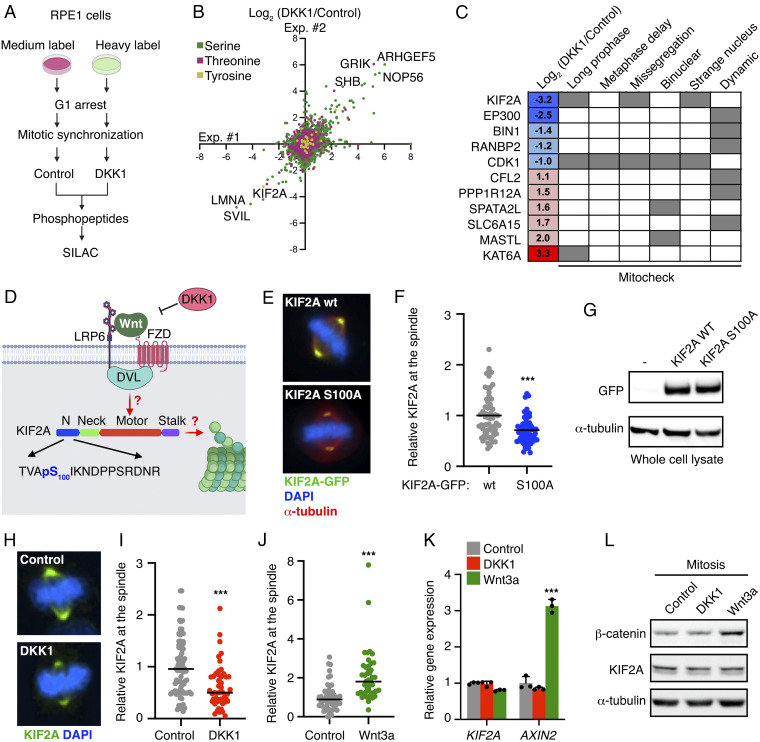
Fig. 1.
Mitotic Wnt signaling recruits KIF2A to the spindle. (A) Scheme of SILAC-MS analysis to identify changes in the phosphoproteome upon Wnt inhibition by DKK1 in mitotic cells. (B) Scatter plot comparing the differential counts of phosphopeptides of two biological replicates. Axes show the log2-fold change in phosphopeptide counts between control and DKK1 treatment in mitotic RPE1 cells. Phosphopeptides are color-coded for their modified residue. (C) Table containing the log2-fold change in the phosphopeptide counts of the indicated proteins from our performed MS screen, and the mitotic phenotypes identified for their siRNAs in the Mitocheck database. (D) Scheme showing the Wnt receptor complex and KIF2A. The phosphopeptide sequence identified in A and B is shown below with KIF2A phospho-S100, which is down-regulated by DKK1, highlighted in blue. (E) Representative immunofluorescence microscopy images showing overexpressed EGFP-KIF2A protein levels (green) in HeLa cells during metaphase. (F) Quantification of overexpressed KIF2A wt and S100A at the spindle of mitotic HeLa cells from E. Means of n > 61 cells per condition of a representative experiment of n = 3 independent experiments are shown. (G) Representative Western blots showing lysates from HeLa cells transfected as indicated. (H) Representative immunofluorescence microscopy images showing endogenous KIF2A protein levels (green) in RPE1 cells during metaphase treated as indicated 1.5 h before mitosis. (I and J) Quantification of spindle associated KIF2A in mitotic RPE1 cells upon 1.5 h treatments with control or DKK1 conditioned media (I) and with control or Wnt3a conditioned media (J). In I, mean of n > 43 cells per condition of a representative experiment of n = 3 independent experiments is shown. In J, mean of n > 44 cells per condition from n = 2 independent experiments that were pooled are shown. (K) qPCR analysis of KIF2A and AXIN2 expression levels in G2/M arrested RPE1 cells upon 1.5 h treatment with the indicated conditioned media. Data are displayed as mean ± SD of 3 replicates. (L) Representative Western blots from n = 3 independent experiments showing cytoplasmic lysates from RPE1 cells synchronized in mitosis and treated for 1.5 h with the indicated conditioned media.

