Fig. 2.
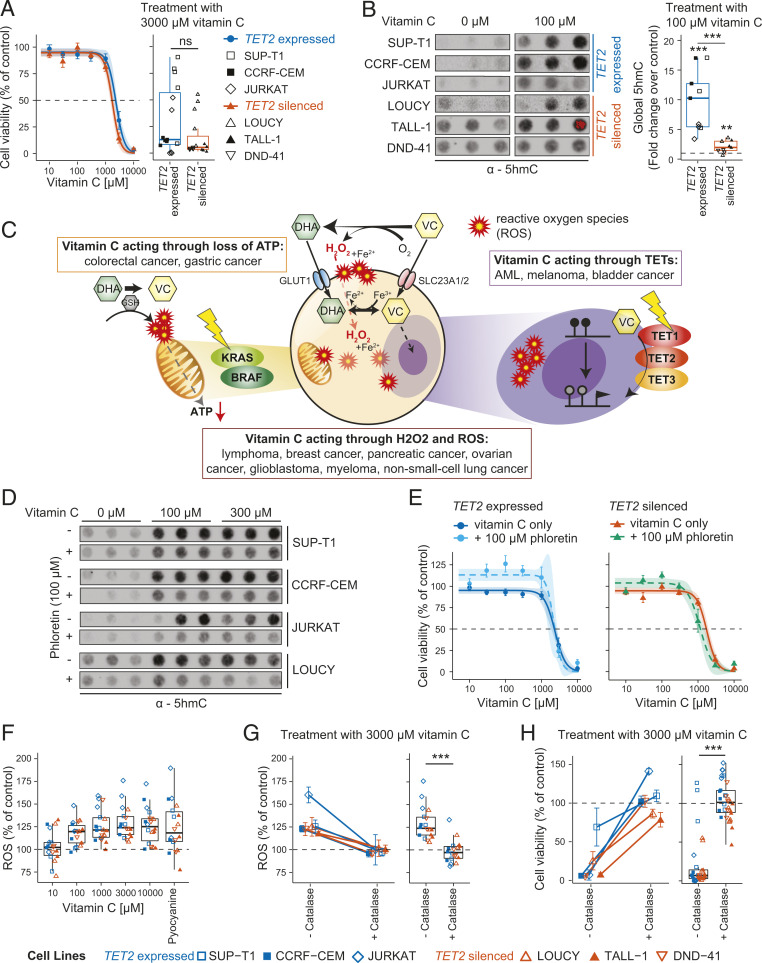
Cytotoxicity of vitamin C (VC) is caused by ROS independently of TET activity in vitro. (A) Cell viability curve for T-ALL cell lines with expressed and silenced TET2 treated with increasing concentrations of VC for 24 h (Left) and boxplot showing cell viability for treatment with 3,000 μM VC compared to untreated control (Right). (B) Dot blot using an antibody against 5hmC in T-ALL cell lines treated with a H2O control or 100 μM VC for 24 h in triplicates (Left); quantification of signaling intensity comparing cell lines with expressed and silenced TET2 relative to untreated control samples (dotted line) (Right). (C) Treatment with VC can mediate its cytotoxic effect through three main pathways: 1) production of hydrogen peroxide (H2O2) and ROS during oxidation of VC to DHA, 2) energy crisis in cancers with a KRAS or BRAF mutation (yellow flash) after DHA is reduced back to VC intracellularly, or 3) cofactor of the TET enzymes (TET1-3) leading to increased enzymatic activity. GSH, glutathione. (D) Dot blot showing global levels of 5hmC in T-ALL cell lines after treatment for 24 h with H2O control or indicated concentrations of VC in the absence (−) or presence (+) of 100 μM phloretin. (E) Cell viability curves for T-ALL cell lines treated with increasing concentrations of VC with or without 100 μM phloretin for cell lines with expressed TET2 (Left) or silenced TET2 (Right). Biological triplicates for three different cell lines each (nexpressed = 9 and nsilenced = 9). (F) Boxplot showing levels of total (intracellular and extracellular) ROS created in response to treatment of T-ALL cell lines with VC at increasing concentrations relative to an untreated control (dotted line); pyocyanine used as a positive control. (G) Intracellular and extracellular ROS created in response to treatment of T-ALL cell lines with 3,000 μM VC without and with the addition of catalase for each cell line individually (Left) and box plot representing all cell lines (Right) relative to an untreated control (dotted line). (H) Cell viability of T-ALL cell lines after treatment with 3,000 μM VC without and with the addition of catalase for each cell line separately (Left) and all cell lines combined (Right). Percentage of untreated control. (A, B, G, and H) Two-tailed, unpaired Student’s t test; ns, P > 0.05; *P ≤ 0.05; **P ≤ 0.01; ***P ≤ 0.001.

