Fig. 1.
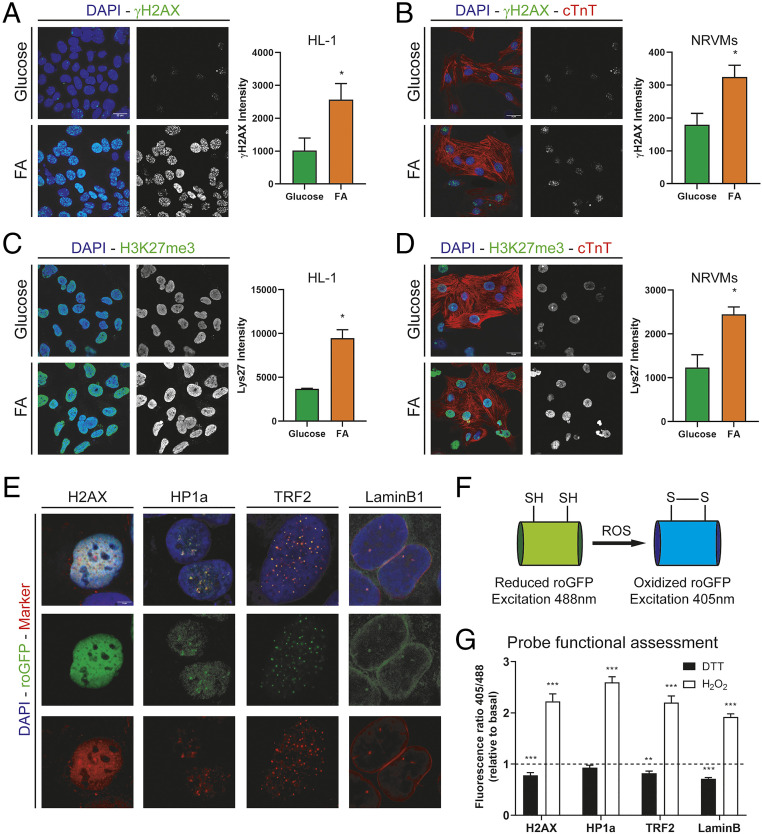
(A) γH2AX staining in HL1 cells treated with 25 mM glucose or 200 µM FA for 24 h. Graph shows γH2AX nuclear intensity quantification (n = 4). (B) γH2AX staining in NRVMs treated with 25 mM glucose or 200 μmM FA for 24 h. Graph shows γH2AX nuclear intensity quantification (n = 3). (C) Histone 3 trimethylated lysine 27 (H3K27me3) staining in HL1 cells treated with 25 mM glucose or 200 µM FA for 24 h. Graph shows γH2AX nuclear intensity quantification (n = 4). (D) Histone 3 trimethylated lysine 27 (H3K27me3) staining in NRVMs treated with 25 mM glucose or 200 µM FA for 24 h. Graph shows γH2AX nuclear intensity quantification (n = 3). (E) Fluorescence images of nuclear targeted probes. roGFP fluorescence is shown in green (Middle). Markers for subnuclear compartments (H2AX, euchromatin; HP1α, heterochromatin; TRF2, telomeres; and lamin B1, nuclear membrane) are shown in red (Bottom). (F) Schematic representation of roGFP in reduced and oxidized states. (G) Fluorescence ratio (405/488) per cell relative to basal levels (low glucose) in the presence of 4 mM DTT (black bars) or 1 mM H2O2 (white bars). For all graphs, bars represent mean ± SEM. ***P < 0.005, **P < 0.01, *P < 0.05; Student’s t test. (Scale bars, 20 µm.)

