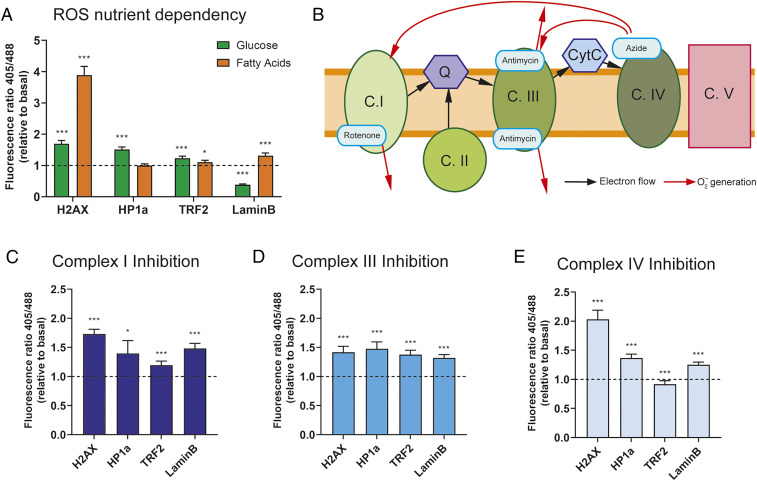
Fig. 2.
(A) Fluorescence ratio (405 nm/488 nm) per cell relative to basal levels (low glucose) in presence of 25 mM glucose (green bars) or 200 µM FA (orange bars). (B) Schematic of mitochondrial electron transport chain with inhibitor binding sites and ROS generation flow (red arrows). (C–E) Fluorescence ratio (405 nm/488 nm) per cell relative to basal levels (low glucose) in presence of 10 µM rotenone (C), 30 µM antimycin A (D) or 20 mM sodium azide (E). For all graphs, bars represent mean ± SEM. ***P < 0.005, *P < 0.05; Student’s t test.

