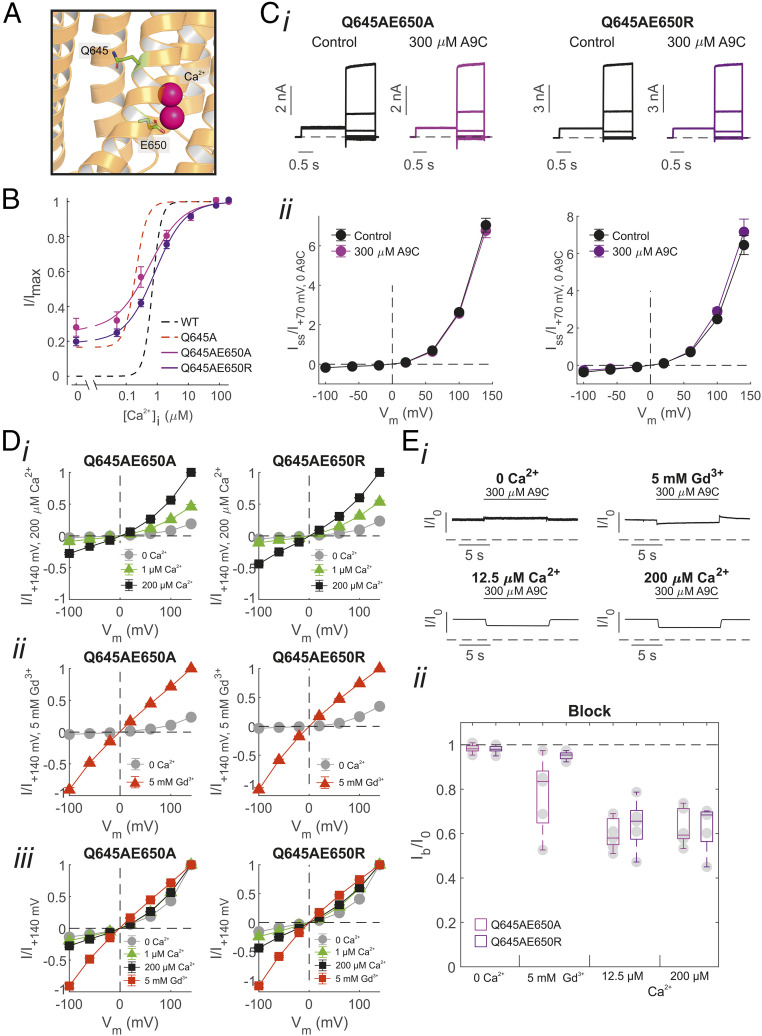
Fig. 4.
Assessment of the contribution of the electrostatic gate on the effect of extracellular A9C on the TMEM16A channel. (A) The cryo-EM structure of TMEM16A with Q645 and E650 highlighted and bound Ca2+ shown in pink (PDB ID: 5OYB). (B) Mean relationships between [Ca2+]i and the current measured at +70 mV in inside-out patches expressing TMEM16A-Q645A-E650A (n = 9) or -Q645A-E650R channels (n = 9). Dashed black and red lines are mean relationships between [Ca2+]i and the current measured at +70 mV for TMEM16A and TMEM16A-Q645A, respectively, and are replotted from Fig. 1. (C) (i) Whole-cell TMEM16A-Q645A-E650A/R currents recorded in response to the “IV tail” protocol. [Ca2+]i was 0. (ii) Mean whole-cell TMEM16A-Q645A-E650A or -Q645A-E650R current versus Vm relationships measured in the absence or presence of 300 µM [A9C]. The number of experiments was 6 to 8 in each case. (D) Mean current versus Vm relationships obtained in inside-out patches expressing TMEM16A-Q645A-E650A/R in the presence of (i) various [Ca2+]i or (ii) 5 mM [Gd3+]i, as indicated. Currents were normalized for the current measured at +140 mV in (i) 200 µM [Ca2+]i or (ii) 5 mM [Gd3+]i. (iii) Mean TMEM16A-Q645A-E650A/R currents versus Vm relationships normalized for the current measured at +140 mV in each case. The number of experiments was 6 to 8 in each case. (E) (i) Whole-cell TMEM16A-Q645A-E650A currents measured at +70 mV and in the presence of 0, 12, 200 μM [Ca2+]i, or 5 mM [Gd3+]i, as indicated. Extracellular A9C (300 µM) was applied (“concentration jump”) as indicated by the horizontal bar. (ii) Mean current inhibition (Ib/I0) plotted as box plot for each channel type. The number of experiments was 5 to 7 in each case. Dashed horizontal lines in Ci and Ei indicate the zero-current level.

