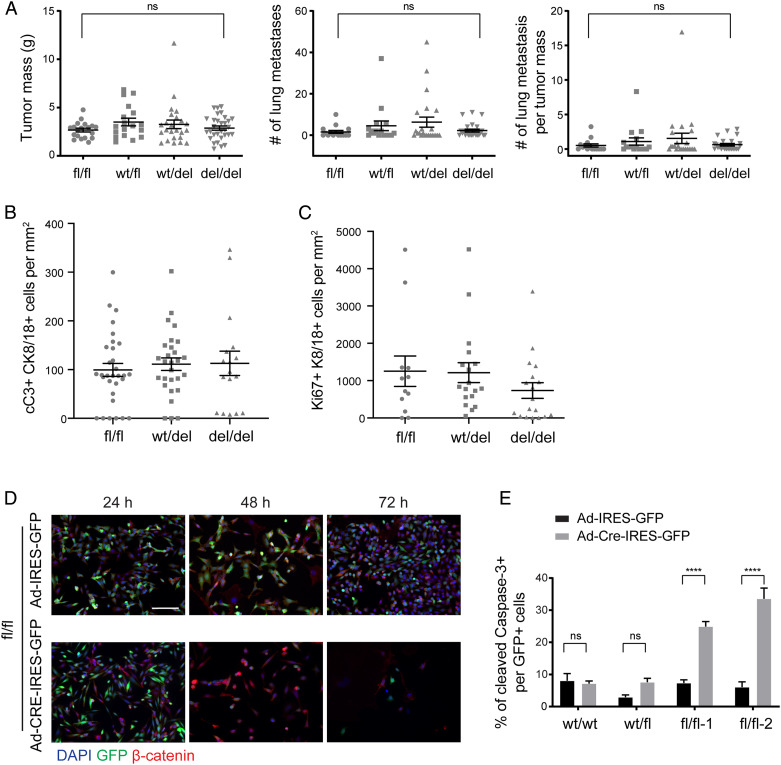
Fig. 1.
Ablation of β-catenin expression leads to mammary tumor cell apoptosis. (A) Cre recombinase-mediated ablation of β-catenin in β-cateninfl/fl;MMTV-PyMT;MMTV-Cre triple-transgenic mice did not affect primary tumor growth and lung metastasis formation. Mouse numbers analyzed for primary tumor growth: β-cateninfl/fl (fl/fl), n = 19; β-cateninfl/wt (wt/fl), n = 18; β-cateninfl/wt;MMTV-Cre (wt/del), n = 24; β-cateninfl/fl;MMTV-Cre (del/del), n = 31. Mouse numbers analyzed for lung metastasis formation: β-cateninfl/fl (fl/fl), n = 15; β-cateninfl/wt (wt/fl), n = 16; β-cateninfl/wt;MMTV-Cre (wt/del), n = 23; β-cateninfl/fl;MMTV-Cre (del/del), n = 24. Data are displayed as mean ± SEM. Statistical analysis was performed using ordinary one-way ANOVA multiple comparison test. ns, not significant. (B) Apoptotic mammary tumor cells were detected by immunofluorescence staining for cleaved Caspase-3 and CK8/18 for tumor cells in preneoplastic lesions of β-cateninfl/fl;MMTV-PyMT (fl/fl; wild-type control), β-cateninwt/fl;MMTV-PyMT;MMTV-Cre (wt/del; heterozygous knockout), and β-cateninfl/fl;MMTV-PyMT;MMTV-Cre (del/del; homozygous knockout) mice at 5 wk of age. The quantification of cleaved Caspase-3–positive/CK8/18-positive cells revealed only a moderate, nonsignificant increase in apoptotic tumor cells upon β-catenin deletion. Data are displayed as mean ± SEM, n = 3 to 4 mice. A representative image of the immunofluorescence staining is shown in SI Appendix, Fig. S2D. (C) Proliferating mammary tumor cells were detected by immunofluorescence staining for Ki67 and CK8/18 for tumor cells in preneoplastic lesions of β-cateninfl/fl;MMTV-PyMT (fl/fl; wild-type control), β-cateninwt/fl;MMTV-PyMT;MMTV-Cre (wt/del; heterozygous knockout), and β-cateninfl/fl;MMTV-PyMT;MMTV-Cre (del/del; homozygous knockout) mice at 5 wk of age. The quantification of Ki67-positive/CK8/18-positive cells revealed only a moderate, nonsignificant decrease in proliferating tumor cells upon β-catenin deletion. The dots in the graphs represent the individual imaging fields analyzed. Data are displayed as mean ± SEM, n = 3 to 4 mice. A representative image of the immunofluorescence staining is shown in SI Appendix, Fig. S2E. (D) Infection of primary tumor cell lines derived from β-cateninfl/fl;MMTV-PyMT tumors with Adenovirus-Cre-IRES-GFP resulted in rapid cell death of infected cells as compared to cells infected with an Adeno-IRES-GFP control virus. DAPI was used to visualize nuclei. (Scale bar, 100 μm.) (E) β-cateninwt/wt (wt/wt; Py2T), β-cateninwt/fl (wt/fl), and β-cateninfl/fl (fl/fl) cells were infected with either Adeno-Cre-IRES-GFP or Adeno-IRES-GFP. The quantification of the number of infected (GFP-positive) and apoptotic (cleaved Caspase-3–positive) cells revealed a significant increase in the numbers of apoptotic cells upon knockout of β-catenin. Data are displayed as mean ± SEM. The results represent four independent experiments. Statistical analysis was performed using one-way ANOVA multiple comparison test. ****P < 0.001; ns, not significant.

