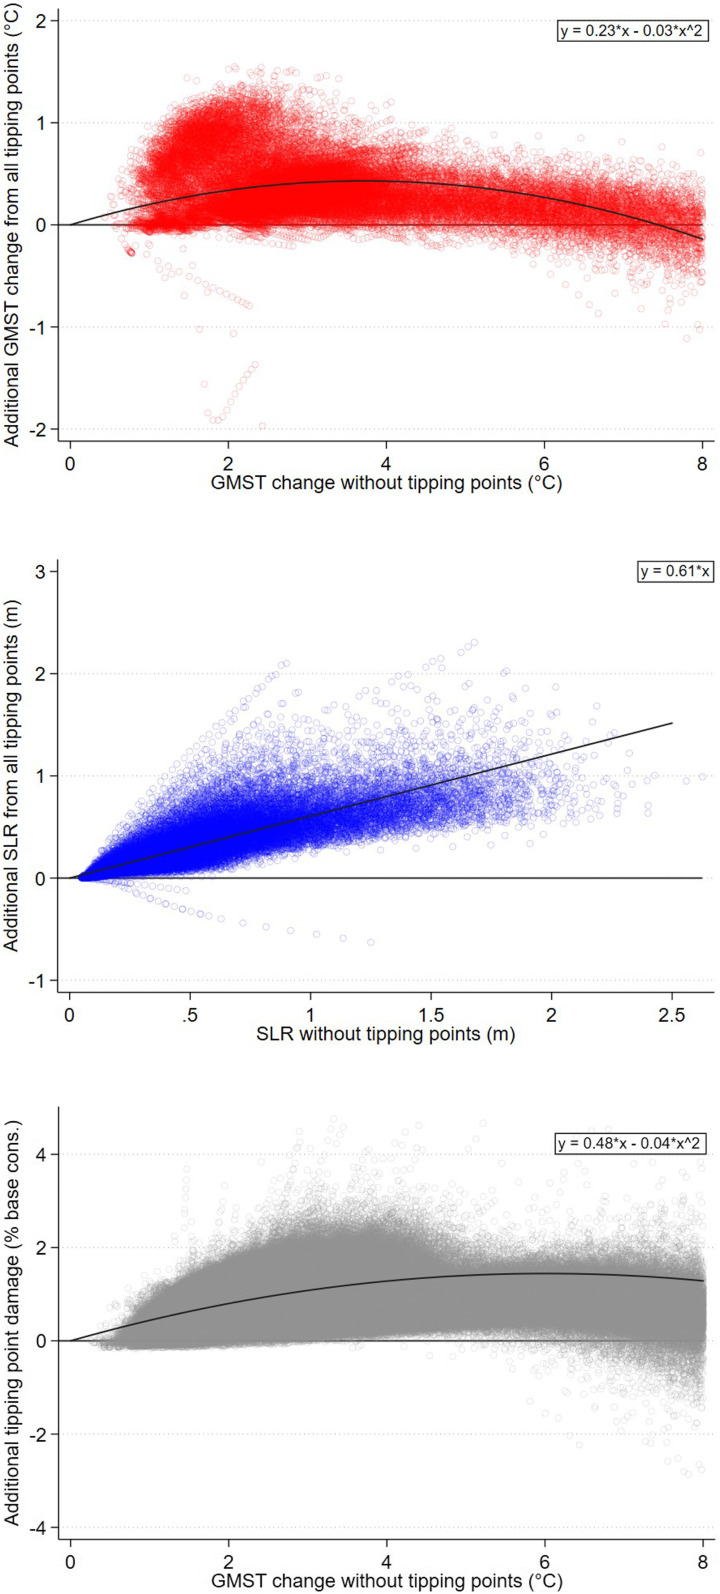
Fig. 5.
Scatterplots of additional warming (Top), SLR (Middle), and damages (Bottom) from all tipping points combined. Data are sampled on a decadal interval (2020, 2030,...2200) using 1,000 Monte Carlo simulations under each of the RCP4.5 and RCP8.5 emissions scenarios. A nonlinear fit is used for temperature and damages; a linear fit is used for SLR. Incremental damage from tipping points is expressed as the change in world consumption per capita due to tipping points, relative to world consumption per capita without climate damages. Specification comprises Hope and Schaefer PCF, Whiteman et al. beta OMH, and IPSL AMOC hosing. GMST, global mean surface temperature.

