Fig. 4.
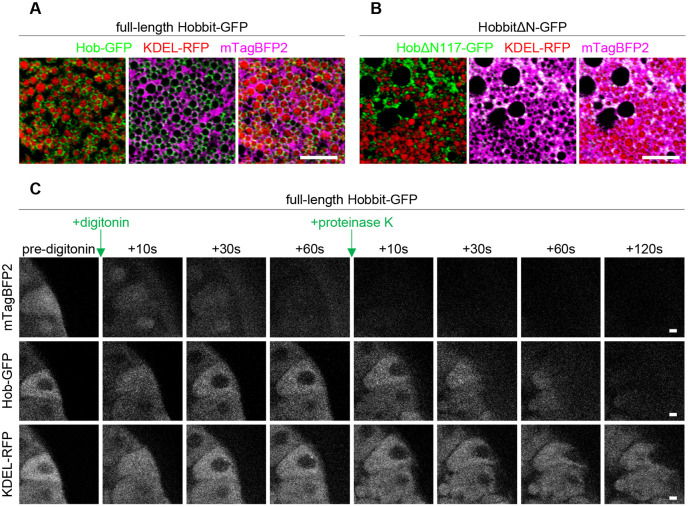
ER membrane localization and topology of Hobbit are conserved in Drosophila. (A) Live-cell imaging of full-length Hobbit–GFP (green), the ER lumen marker KDEL–RFP (red) and cytosolic mTagBFP2 (magenta) in the Drosophila larval salivary glands at the onset of metamorphosis (0 h after puparium formation, PF) shows that Hobbit–GFP localizes to the ER membrane. Full genotype: UAS-KDEL-RFP/+; Sgs3>hob-GFP/UAS-mTagBFP2. (B) Live-cell imaging of N-terminally truncated HobbitΔN117–GFP (green), the ER lumen marker KDEL–RFP (red) and cytosolic mTagBFP2 (magenta) at 0 h PF shows that HobbitΔN117–GFP localizes to the cytosol. Full genotype: UAS-KDEL-RFP/+; Sgs3>hobΔN117-GFP/UAS-mTagBFP2. Images in A and B show a single slice from a z-stack comprising three optical sections at a 0.28 µm step size. (C) Imaging-based protease protection assay shows that the C-terminus of Drosophila Hobbit faces the cytosol. Cytosolic mTagBFP2 (top) rapidly diffuses out of the cells after permeabilization with digitonin, while Hobbit–GFP (middle) and KDEL–RFP (bottom) are unaffected. Hobbit–GFP (tagged at the C-terminus) is degraded after subsequent addition of proteinase K, while KDEL–RFP is unaffected. Note that the cells flatten after addition of proteinase K. Experiment was conducted using 0 h PF glands. Full genotype: UAS-KDEL-RFP/+; Sgs3>hob-GFP/UAS-mTagBFP2. Images shown are representative of three independent experiments with n≥10 salivary glands from independent animals analyzed per genotype. Scale bars: 5 µm (A,B); 10 µm (C).

