FIGURE 3.

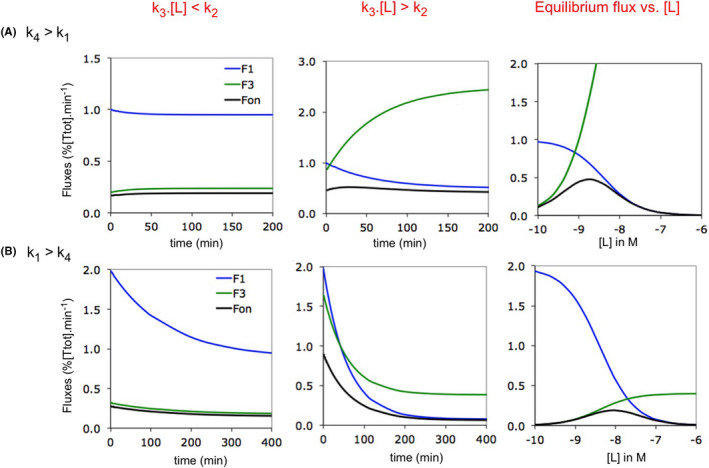
Forward fluxes for CS binding: implication of the ([L]·k3)/k2 and k4/k1 ratios. Simulated plots are for isolated CS binding. Microscopic rate constants are provided in Supporting Information Section S3. Data for t = 0 not presented. (A) The model complies with the traditional “rapid equilibrium binding” paradigm (i.e., with k4 > k1). Left side: forward fluxes versus time at low [L] = 0.2 nM. Such as for IF (Figure 2C), Fon is essentially dictated by F3 at all times. Mid: forward fluxes versus time at higher [L] = 4 nM. Fon becomes essentially dictated by F1 (i.e., Biv‐like, Figure 2C) as time goes by. Right side: forward fluxes versus [L] at equilibrium. The Fon versus [L] plot adopts a bell‐shaped pattern with a F3‐ dictated ascending portion and a F1‐ dictated descending portion. (B) Plots such as in (A) for the alternative CS binding model14, 17, 32 in where the conformational change proceeds faster (i.e., with k4 < k1). Low [L] = 5 nM and high [L] = 100 nM. The observations are quite similar as for the traditional model in (A). This contrasts with the hyperbolically decreasing kobs versus [L] plot for the traditional model and hyperbolically decreasing plot for the alternative model (Supporting Information Section S4). Finally, Fon is not maximal when the F1‐ and F3 versus [L] plots intersect because of their different curvature (right side)
