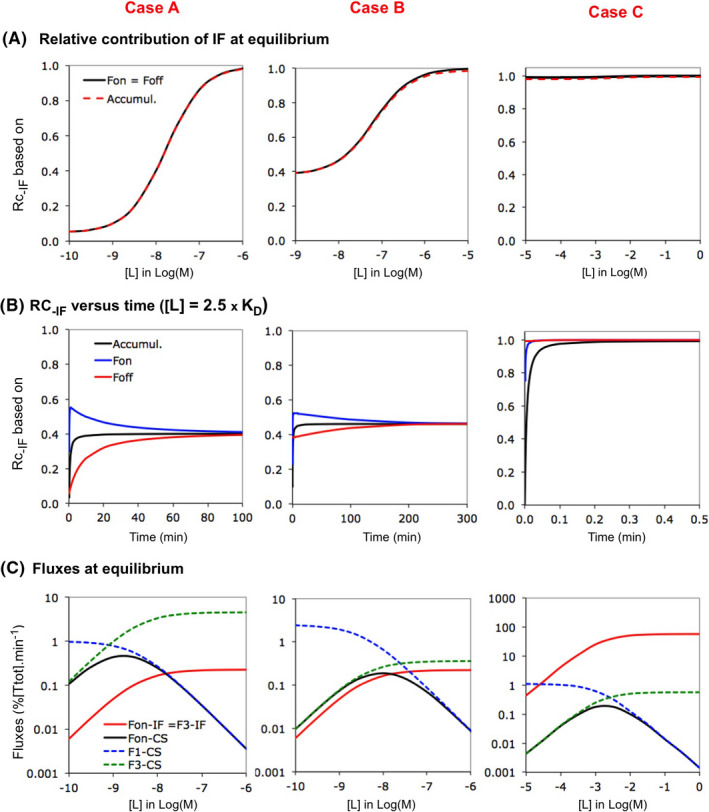
FIGURE 4.

Competition between pathways of a thermodynamic cycle: IF versus CS. Competition between IF and CS is evaluated for three Cases. Both pathways comply with the classical frame of reference for Case A (see “Definition”). The two other cases diverge. The conformational change proceeds faster than the binding for CS For Case B (such as in Figure 3B) and Case C is based on kinetic data provided by Zhou et al.24 The latter values are 106‐ fold lower for the sake of comparison. Please see Supporting Information Section S3 for microscopic rate constants and important ratios thereof. (A) The relative contribution of IF to T*L, “Rc‐IF” increases with [L] for the three Cases at equilibrium. Rc‐IF can be expressed in terms of Fon (i.e., Rc‐IF = Fon‐IF/(Fon‐IF + Fon‐CS)), Foff and the accumulation of T*L (same type of equations). These three modes of calculation yield nearly‐ overlapping plots for each Case (hence only one color. Rc‐IF at very low [L] differs among the Cases: i.e., from <0.5 (CS‐ dominant) for Case A to nearly 1 (outspokenly IF‐ dominant) for Case C.24 (B) The evolution of Rc‐IF with time is shown for the three cases for [L] = 2.5 × KD. Note that, while the three approaches provide different Rc‐IF‐ values early on for each given case, they become closely the same at equilibrium. (C) Evolution of microscopic and macroscopic fluxes at equilibrium as a function of [L]. Such as for the individual pathways in Figures 2 and 3, Fon is dominated by F3 for both IF and CS at low [L]. Hence, the different Rc‐IF values low [L] relates to F3‐IF << F3‐CS for Case A, F3‐IF ≈ F3‐CS for Case B and F3‐IF >> F3‐CS for Case C. The bell‐shaped Fon versus [L] profile for CS is preserved when moving from the isolated CS pathway (Figure 3) to the cycle and the drop of Fon‐CS at higher [L] permits Rc‐IF to increase
