FIGURE 6.

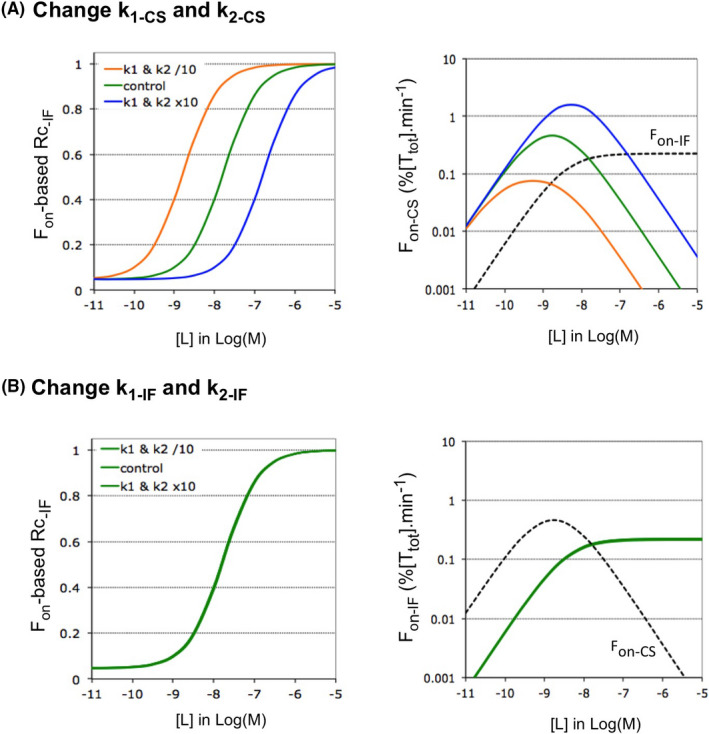
Impact of the rate of the first step of each pathway on Rc‐IF at equilibrium. Microscopic rate constants k1 and k2 are changed 10‐fold in tandem for a single pathway of Case A. The impact thereof on the Rc‐IF is also shown for Case B in Supporting Information Section S5. (A) Left side: Decreasing or increasing the value of the k1CS–k2‐CS tandem shifts the ascending portion of the Rc‐IF versus [L] plots in the same way (i.e., to lower and higher [L], respectively) without affecting Rc‐IF at low [L]. Right side: The horizontal shifts can be related to the ability of Fon‐CS to start descending at lower and higher [L], respectively. The more complex link between k1CS and the shifts is further documented in Supporting Information Section S6. (B) Left side: Decreasing or increasing the value of the k1IF–k2‐IF tandem does not affect the Rc‐IF versus [L] plots. Left side: the Fon‐IF versus [L] plots are not affected either
