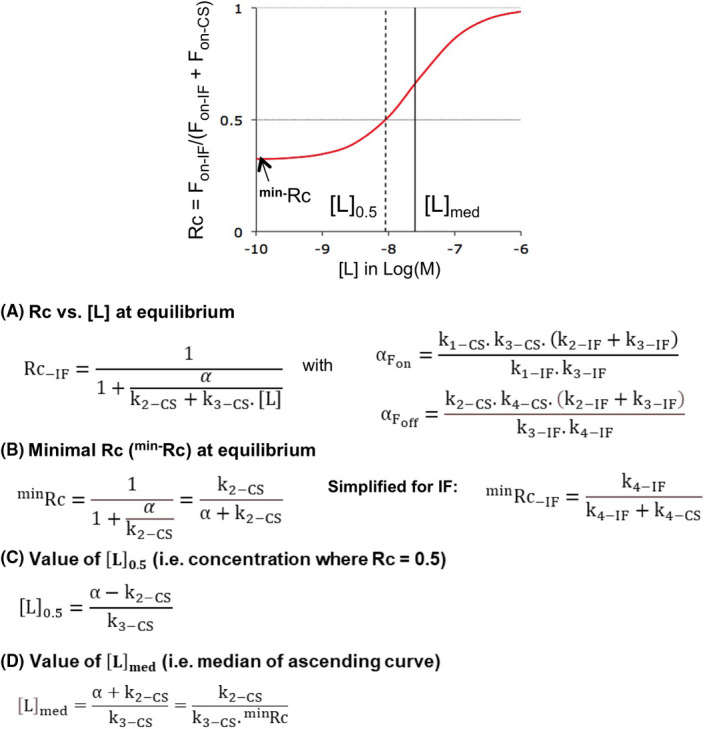
FIGURE 7.

All equations refer to equilibrium binding and, unless explicitly specified, Rc applies to IF as well as to Biv (Supporting Information Section S2). The graph at the top shows the parameters that define a Rc versus [L] plot: minRc for the minimal value of Rc (i.e., when [L] reaches 0), [L]med for [L] at which the ascending portion of the plot is half‐maximal and [L]0.5 for [L] at which IF and CS contribute equally (i.e., when Rc = 0.5). Please see Supporting Information Section S8 for the elaboration of the equations. They are all based on the conditional rate‐ based equations for Fon and Foff (Figure 1B).21 (A) Equations for Rc at all [L]: The Fon‐ and Foff‐ based approaches yield the same value for the recurrent parameter, α. (B) minRc: The conditional rate‐ based equations can be simplified when [L] = 0 (see also Supporting Information Section S2). Simplification of the Foff‐ based equations discloses the implication of k4‐IF and k4‐CS for IF‐CS‐ based cycles. (C) IF and CS contribute equally at [L]0.5. The presented equation is mathematically equivalent to the one in.21 Those do obviously not apply when minRc exceeds 0.5. (D) [L]med refers to “Median” value of [L], i.e., at which the Rc versus [L] plot is half‐maximal between minRc and 1. Please see Table 1 for numerical values
