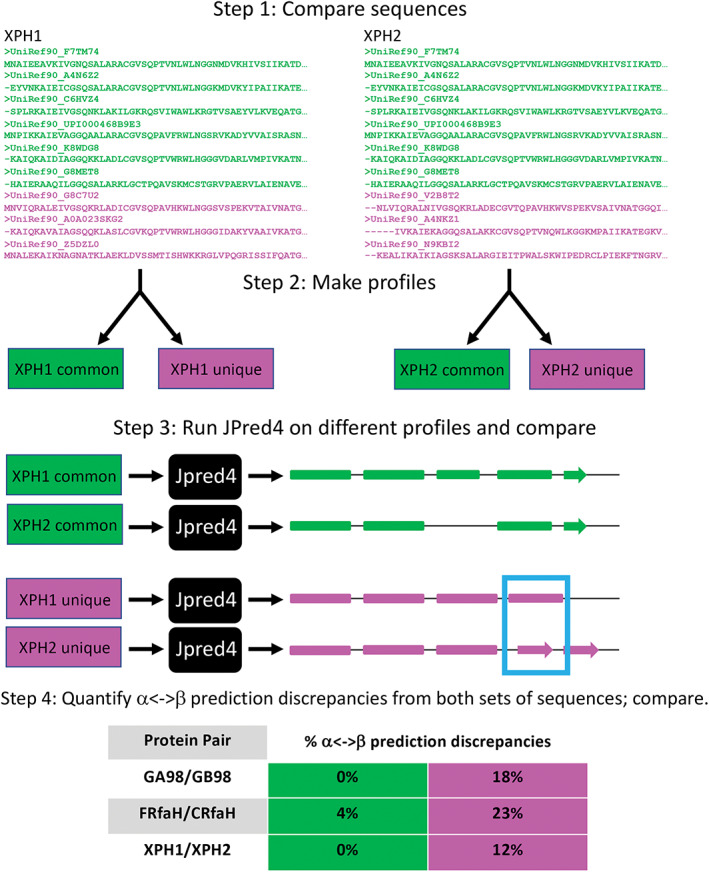
FIGURE 5.

A strategy for determining whence different JPred4 secondary structure predictions arise. Step 1 shows a subset of sequences from the multiple sequence alignments (MSAs) that JPred4 generates from PSI‐BLAST searches. Green sequences were in MSAs from both XPH1 and XPH2; magenta sequences were unique to either XPH1 or XPH2. Step 2 depicts the common and unique sequences being converted to profiles. We generated these profiles from HMMer[ 32 ] and PSI‐BLAST[ 27 ] using the same methodology as JPred4 (Methods). In step 3, we input profiles into JPred4 and compare their secondary structure predictions; α‐helices are rounded rectangles, and β‐strands are arrows. A region of α‐helix <‐> β‐strand discrepancy is highlighted in a blue box. Percent α‐helix <‐> β‐strand discrepancies are quantified and compared in Step 4. JPred4 predicts substantially higher levels of α‐helix <‐> β‐strand discrepancies from unique sequence profiles than from common ones
