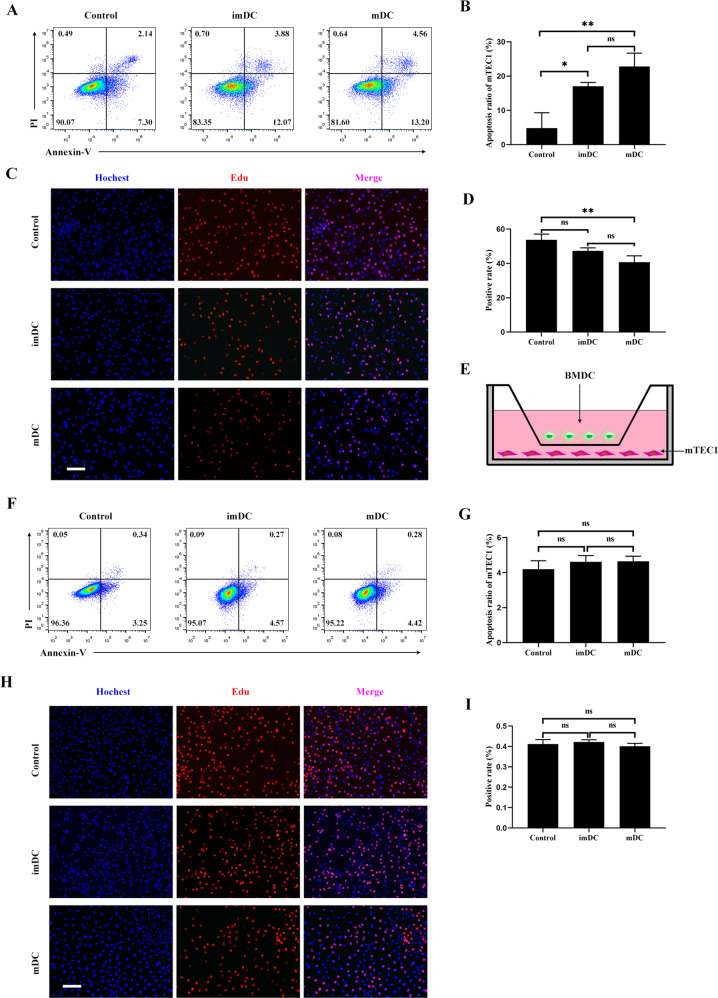
Fig. 2. DCs induced the apoptosis and inhibited the proliferation of mTEC1 cells through direct cell–cell contact.
A mTEC1 cells were cocultured with imBMDCs or mBMDCs at a 1:3 ratio for 48 h, and cell apoptosis was examined through Annexin V/PI staining with FCM. mTEC1 cells alone were set as the control group. B The percentages of apoptotic cells in different groups were determined according to panel A. C mTEC1 cells were cocultured with imBMDCs or mBMDCs at a 1:3 ratio for 48 h, and cell proliferation was examined using an EdU incorporation assay. Red fluorescent dots indicate proliferating cells. Scale bars represent 100 µm. D The percentages of red fluorescent dots in all cells were calculated according to panel C. E Sketch map of the transwell system. mBMDCs were seeded in the upper well, and mTEC1 cells were seeded at the bottom chamber under the membrane. F mTEC1 cells were cocultured with imBMDCs or mBMDCs in the transwell system for 48 h. Cell apoptosis was examined through Annexin V/PI staining by FCM assay. G The percentages of apoptotic cells in different groups were examined according to panel F. H mTEC1 cells and imBMDCs or mBMDCs were cocultured in the transwell system for 48 h. Cell proliferation was examined by using an EdU incorporation assay. Red fluorescent dots represent proliferating cells. Scale bars represent 200 µm. I The percentages of red fluorescent dots in all cells were computed according to panel H. All data are from three independent experiments. Representative figures of these three experiments are shown. Data are represented as the mean ± SD. *P < 0.05, **P < 0.01, compared with the control group.

