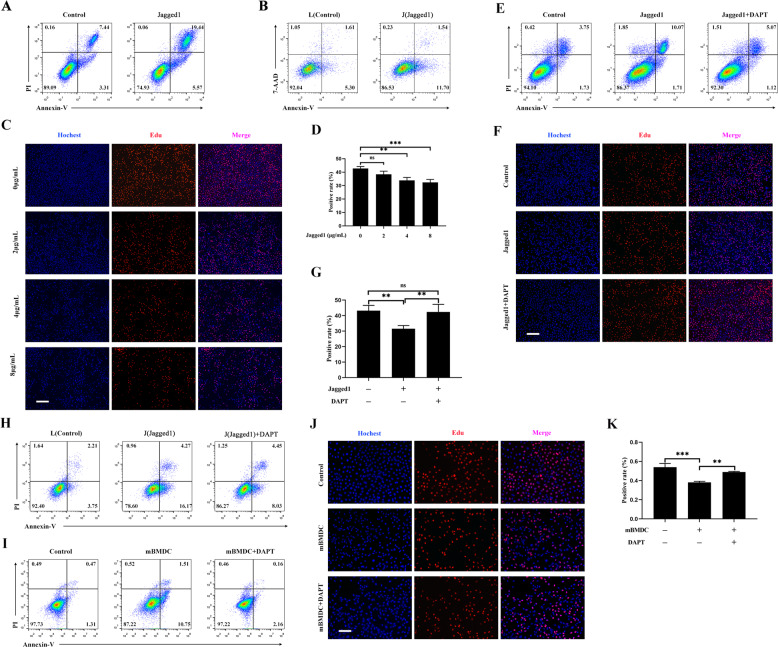
Fig. 4. Mature DCs promoted the apoptosis and inhibited the proliferation of mTEC1 cells by activating Notch signaling.
A rmJagged1-hFc was precoated on a 24-well plate at 4 °C for 12 h. BSA precoated at the same concentration was used as the control. mTEC1 cells were seeded at a density of 6 × 10⁴ cells per well. Cell apoptosis was examined through staining with Annexin V/PI. B L and J cells were pre-stained with CFSE. mTEC1 cells were then cocultured with L or J cells at a 1:3 ratio for 48 h. The apoptosis of mTEC1 cells was examined through staining with Annexin V-APC/7-AAD. C The different concentrations of rmJagged1-hFc were precoated on 96-well plates at 4 °C for 12 h. The same concentration of BSA was set as the control group. mTEC1 cells were seeded at a density of 5 × 10³ cells per well. Cell proliferation was examined using an EdU incorporation assay after 48 h. The red fluorescent dots indicate proliferating cells. Scale bars represent 200 µm. D The percentages of red fluorescent dots in all cells were calculated according to panel C. E Experiments were performed as described in A. mTEC1 cells were treated with or without DAPT (10 μM). Cell apoptosis was analyzed through Annexin V/PI staining. F Experiments were performed as described in C. Proliferation was detected by performing an EdU incorporation assay. mTEC1 cells were incubated with or without DAPT (10 μM). Red fluorescent dots indicate proliferating cells. Scale bars represent 200 µm. G The percentages of red fluorescent dots in all cells were calculated according to panel F. H Experiments were performed as described in B. mTEC1 cells were treated with or without DAPT (10 μM). I Experiments were performed as shown in Fig. 2A. mTEC1 cells were cultured with or without DAPT (10 μM). J Experiments were performed as shown in Fig. 2C. mTEC1 cells were treated with or without DAPT (10 μM). Scale bars represent 200 µm. K The percentages of red fluorescent dots in all cells were calculated according to panel J. All data are from three independent experiments. Representative figures of these three experiments are shown. Data are expressed as the mean ± SD. **P < 0.01, ***P < 0.001 compared with the control group.

