Figure 2.
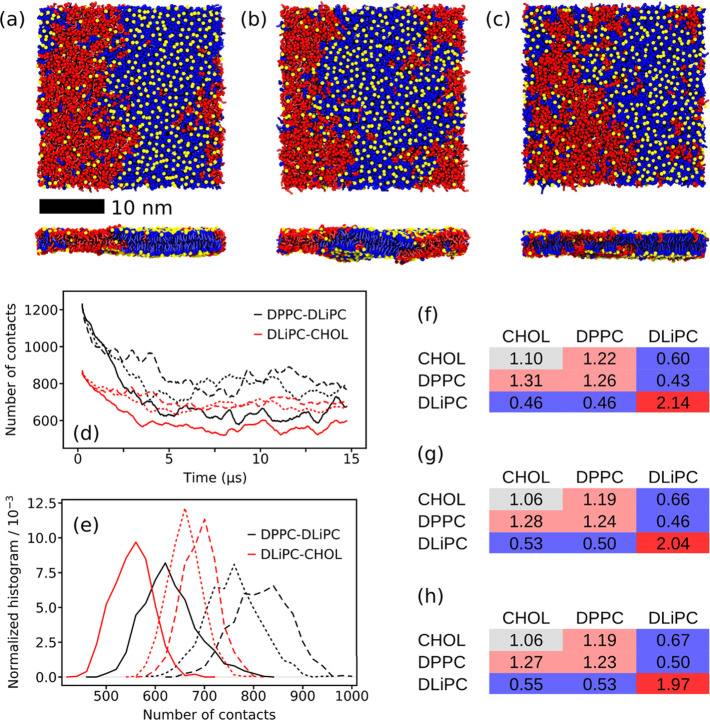
Membrane organization of the ternary lipid mixture DPPC/DLiPC/CHOL. (a–c) Top and side views of the DPPC (blue)/DLiPC (red)/CHOL (yellow) membrane after 15 μs of simulation. The simulations were performed using (a) one and (b) three temperature coupling groups for the lipids, respectively. In (c), stricter LINCS settings (lincs_order = 8 and lincs_iter = 2) were applied. The phospholipid headgroups are omitted for clarity, and CHOL is represented by the ROH bead only. (d) Number of contacts between DPPC–DLiPC (black) and DLiPC–CHOL (red) analyzed for the linker beads of the phospholipids and the ROH bead of CHOL. The solid lines were obtained with one temperature coupling group, the long dashed lines with three temperature coupling groups, and the short dashed lines with lincs_order = 8 and lincs_iter = 2. (e) Histograms of the number of contacts depicted in (d) calculated from the last 5 μs of simulation. Colors and line styles are identical with (d). Relative neighboring data using (f) one temperature coupling group, (g) three temperature coupling groups, and (h) lincs_order = 8 and lincs_iter = 2, respectively, calculated for the last 2 μs of simulation. Errors are below 0.01 in (f)–(h).

