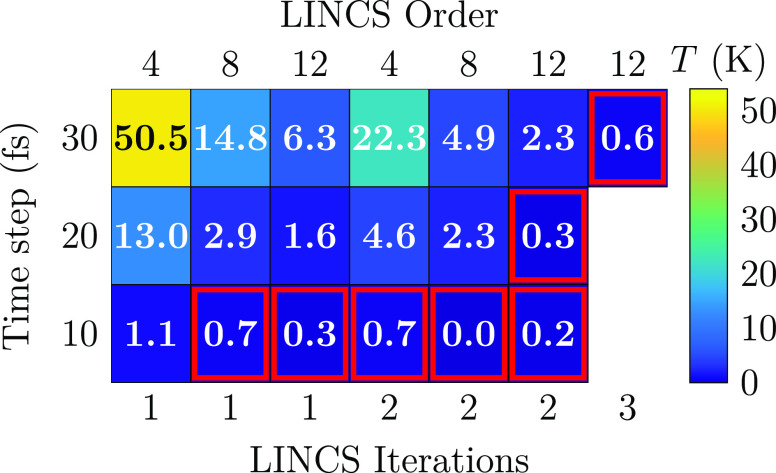
Figure 3.
Temperature difference of DPPC and DLiPC lipids with selected LINCS settings in the ternary DPPC/DLiPC/CHOL mixture. The last 4.9 of the 5 μs long simulations were used for the analysis. For a complete set of data, see Figure S3 in the SI. The error estimates for the lipid temperatures from block averaging are of the order of 0.2 K (10 fs), 0.3 K (20 fs), and 0.4 (30 fs).

