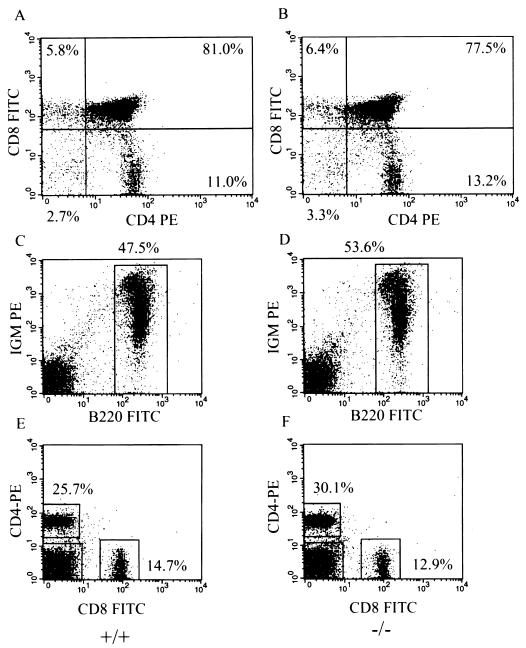
FIG. 7.
FACs analyses of thymocytes and splenocytes isolated from wild-type and Smad3 null mice demonstrate normal T-cell and B-cell development. (A and B) Representative FACs analysis of wild-type and Smad3 null thymocytes, using αCD4-PE and αCD8-FITC. (C to F) Representative FACS analysis of wild-type and Smad3 null splenocytes, using the indicated conjugated antibodies. All data was gated for viable cells by the absence of 7AAD staining. Percentages represent the proportions of viable cells in each region or quadrant.

