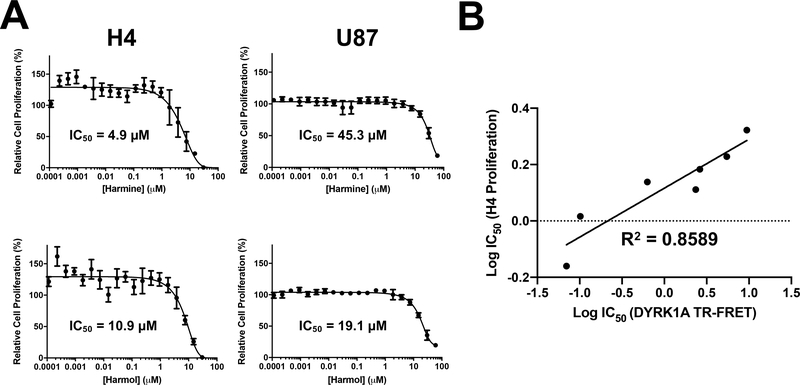
Fig 4.
Effect of harmine and harmol on glioma cancer cell proliferation. (A) H4 and U87 cells were incubated with harmine and harmol (0.0001 – 25 μM) for 72 h, and proliferation assessed by Presto Blue. For each concentration, percent inhibition values were calculated and data normalized to vehicle. Dose response curves were generated using non-linear regression and IC50 values determined in GraphPad Prism 7. (B) Correlation of IC50 values between DYRK1A TR-FRET and H4 proliferation assays, linear regression fit. Dose response curves for the other analogs are shown in the accompanying Data in Brief article (Tarpley et al. 2021b).

