
FIGURE 2.
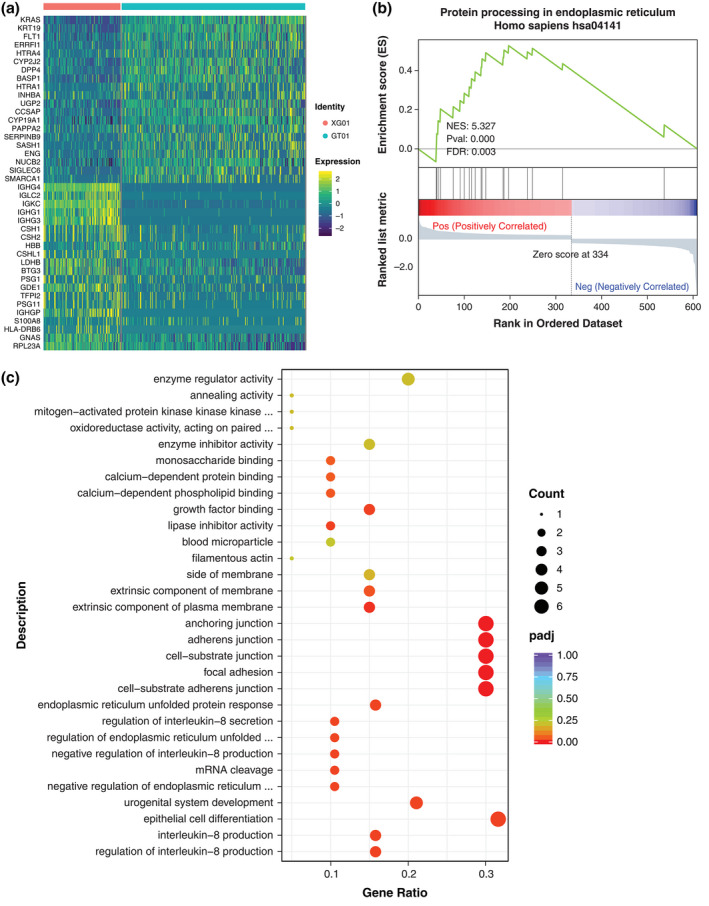
SCT differentially expressed genes and functional changes between the hypertensive group and the healthy pregnancy group. (a) Heat map showing the TOP 40 DEGs, including downregulated and upregulated genes, in SCTs. (b) GSEA result confirming enrichment of the protein processing signaling pathway found in endoplasmic reticulum expression in preeclampsia. (c) GO enrichment term of upregulated genes in SCTs