
FIGURE 4.
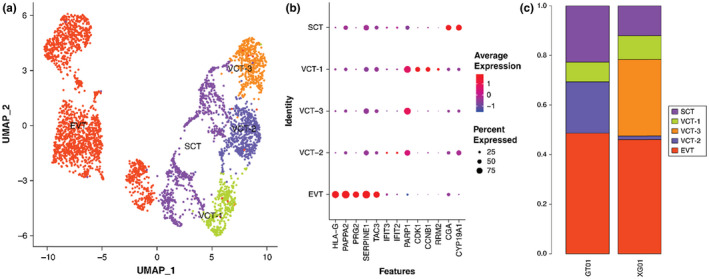
Trophoblast subtypes are present. (a) Biaxial scatter plot showing single‐cell transcriptomic clustering of the VCT subtype using UMAP analysis. (b) Biaxial scatter plots showing the expression pattern of specific genes among different trophoblast cell subgroups. (c) The histogram shows the proportion of VCT subtypes in the preeclampsia group and the healthy pregnancy group. VCT‐2 is mainly distributed in the preeclampsia group, while VCT‐3 is mainly distributed in the healthy pregnancy group