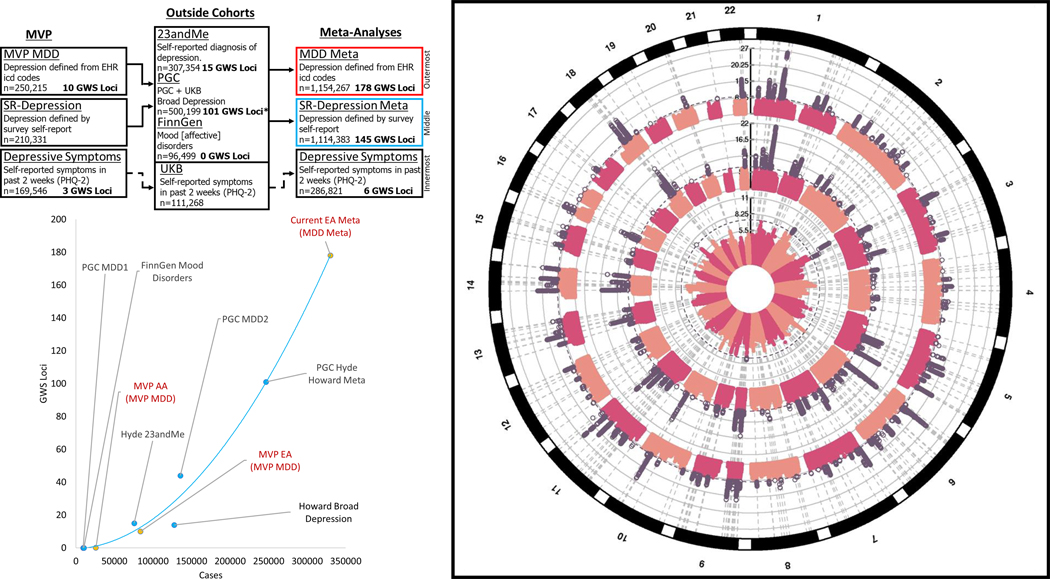
Figure 1. Design of the study and circular Manhattan Plot.
Left Panel: Design of the study (top). Three phenotypes were evaluated within MVP: MDD-META (outermost ring, right panel) which was derived from ICD codes, SR-Depression (middle ring, right panel) which was defined by self-reported diagnosis of depression in the MVP survey, and Depressive symptoms (innermost ring, right panel) which come from the PHQ2 2-item scale found in the MVP survey. MVP-MDD and SR-Depression were each meta-analyzed with depression results from:23andMe, PGC, and FinnGen. MVP PHQ2 was meta-analyzed with results from the PHQ2 2-item scale from UK biobank. Right Panel: Circular Manhattan Plot. Significant results are highlighted in purple. Lower left Panel: Accelerating pace of loci discovery in depression GWAS. Y axis indicates the number of discovered loci in a study, with the X axis showing the number of cases included in each study. Red text and yellow markers indicate original analyses conducted for this study using MVP data for EA, AA and the overall MDD-META meta-analysis of EAs.

