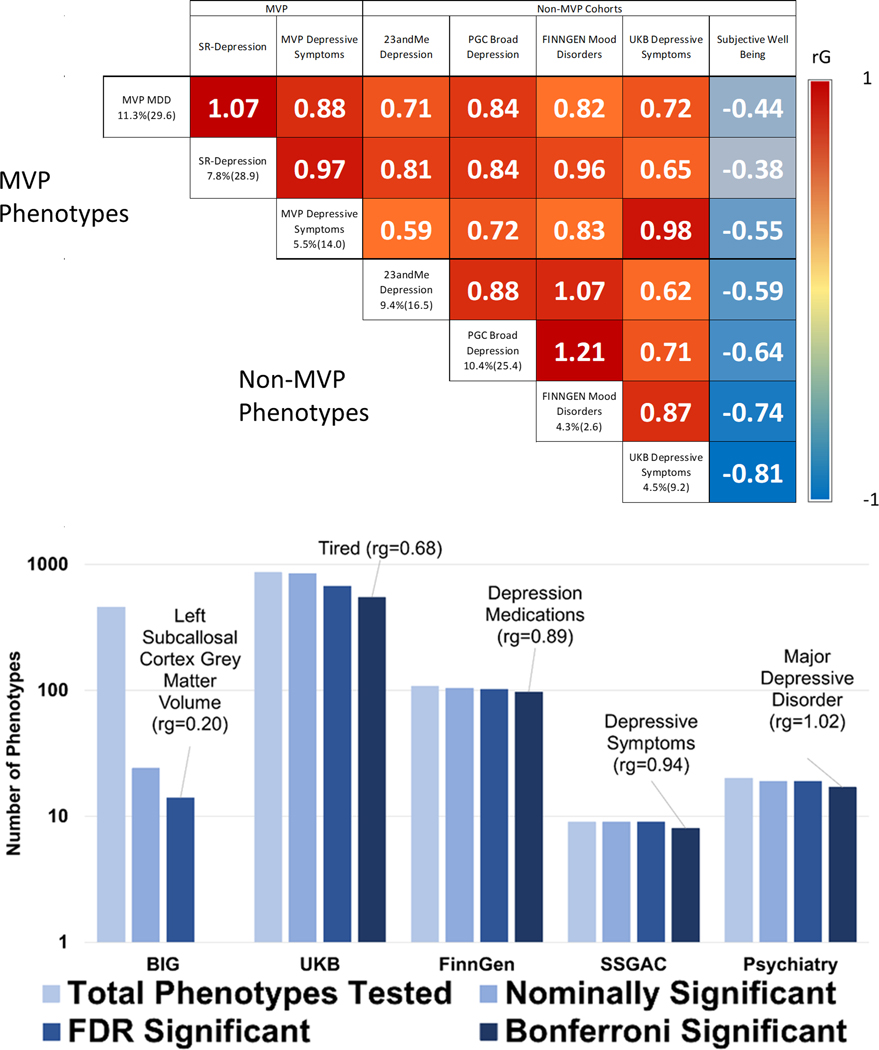
Figure 2. Genetic Correlation.
Upper Panel. Genetic correlations between depression phenotypes, with subjective well-being included as a negative correlation comparator. Heritability (z-score) is given along the left axis of the matrix for each depression phenotype. Values within the matrix represent rg. All correlations are significant following Bonferroni correction for multiple comparisons (0.05/28=p<0.0018). The largest p-value was for the correlation between FinnGen and UKB Depressive symptoms (p=4.06×10–05). P-values and 95% CI are reported in Table S6. Lower Panel. Summary of genetic correlation between MDD-META and 1,457 phenotypes from large-scale genetic studies of mental health and behavior. The Psychiatry category contains phenotypes from the Psychiatric Genomics Consortium, GWAS & Sequencing Consortium of Alcohol and Nicotine use, Million Veteran Program, and International Cannabis Consortium. The labels Tired and left subcallosal cortex grey matter volume represent UKB Field ID 2080 and BIG Field ID 0078, respectively. P-values are two-sided.

