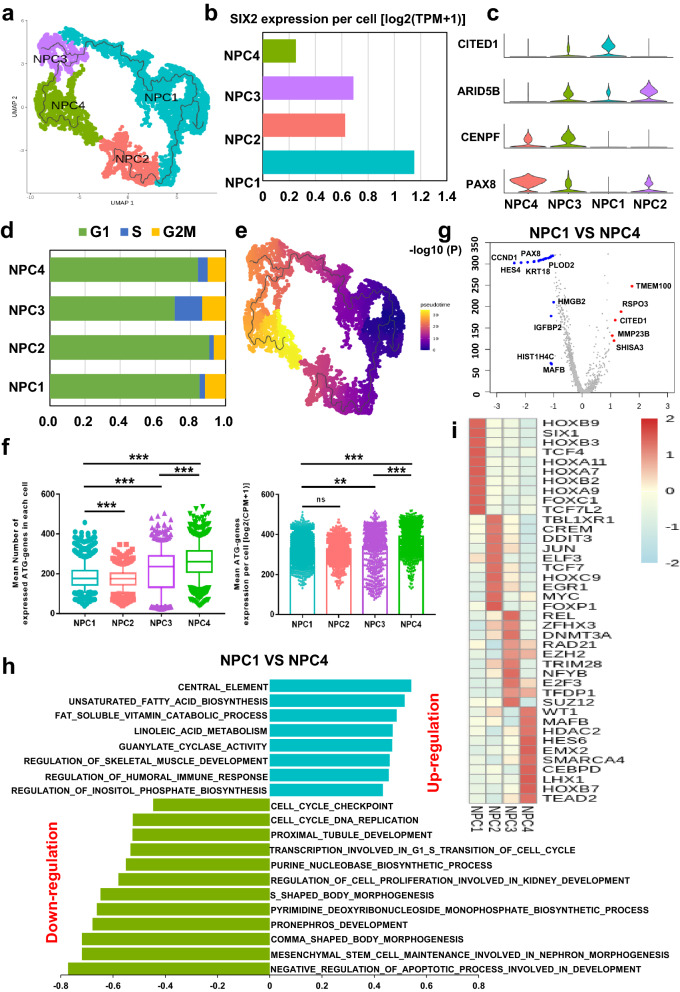
Fig. 2.
Heterogenetic NPCs niche present comprehensive gene expression pattern. a UMAP plot of NPCs subgroups of NPC1-NPC4 with different color annotations. b The SIX2 expression per cell [log2(TPM + 1)] in each single cell of four NPCs subgroups. c The violin plot presents marker genes of NPC1-NPC4, CITED1, ARID5B, CENPF, PAX8. d Cell cycle scores (G1, G2M, S) of each NPC subgroup. e The pseudotime trajectory plot of NPCs subgroups. The pseudotime showed the differentiation start to the end. f Different ATG expression of NPCs subgroups, ** represented P value < 0.01; *** represented P value < 0.001. g DEGs of NPC1 and NPC4: red dots represent upregulated genes in NPC1; blue dots represent down-regulated genes in NPC1. h GSVA results of NPC1 vs. NPC4. The left and right bar represented the downregulation and upregulation pathways respectively. i Top 10 enriched TFs in each subgroup of NPCs

