Fig. 5.
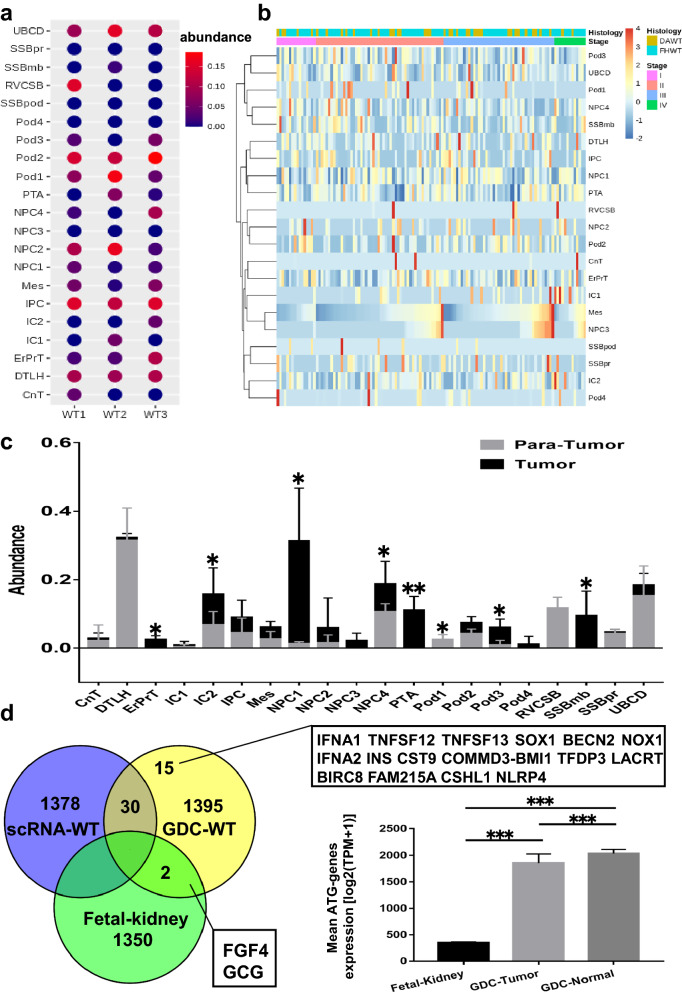
Characteristics of cell types identified by scRNA-seq in public WT RNA-seq cohort. a Relative abundance of cell types in WT scRNA-seq tumor samples calculated by CIBERSORTx. The bubble color presented the abundance of each cell type identified by scRNA-seq in the bulk RNA-seq samples. b Relative abundance of cell types in WT bulk RNA-seq tumor samples calculated by CIBERSORTx, clustered by histology and TNM stage. c Comparison of relative abundance between tumor samples and para-tumor samples from TARGET WT cohort. * represents p < 0.05; ** represents p < 0.01. d Venn diagram of ATG genes among three databases, 1395 of total 1411 ATG genes were recognized; overlapped genes were listed (left). The comparison of ATG expression among fetal kidney, TARGET tumor and normal samples. *** represents p < 0.001

