Fig. 6.
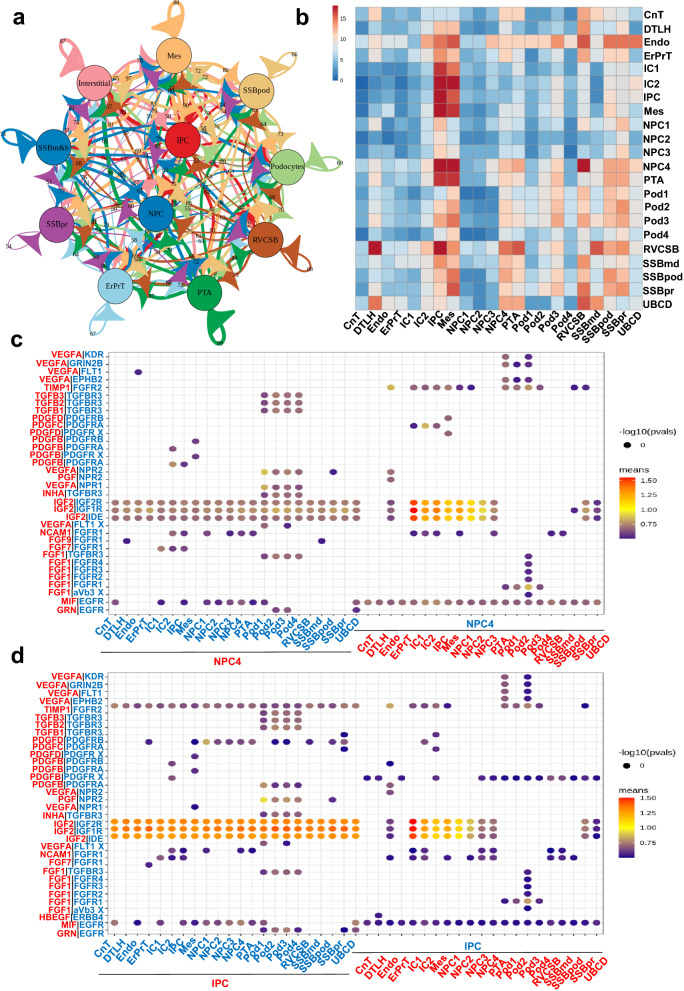
Cell–cell communication network in human fetal renal cell types. a The interaction network established by CellphoneDB; size and number of lines represents interaction counts. b Heatmap presents the number of potential ligand–receptor pairs between cell groups. c Bubble plots present ligand–receptor pairs of growth factors targeted to NPCs. The interactions intensity was presented by the bubble color. d Bubble plots present ligand–receptor pairs of growth factors targeted to IPCs. The interactions intensity was presented by the bubble color

