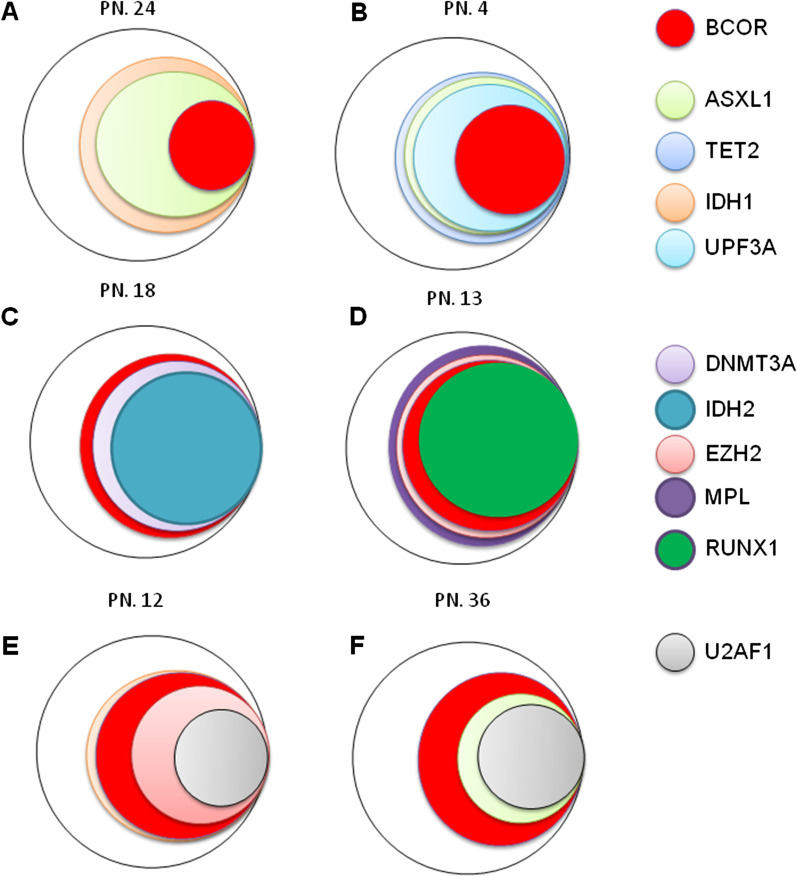
Fig. 2.
Repartitioning of BCOR mutations and other mutations. For each gene, the percentage represents the estimated percentage of cells carrying the unique mutation. Panels a and b show examples of lower VAFs for BCOR mutations than other co-mutated genes (such as ASXL1 or TET2) in 2 patients. Panels c and D show BCOR mutations that are parallel with other mutations (DNMT3A or IDH2 mutations). In panels e and f, BCOR mutations presented as earlier events than other mutations (such as U2AF1 mutations). PN presented patient number in Additional file 1: Table S1

