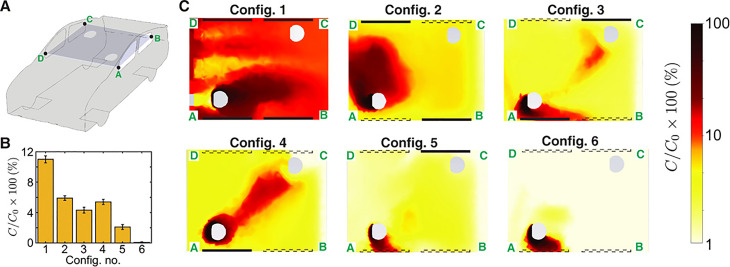
FIG. 12.
(a) Concentration fields are displayed on a schematic of the car with a cut plane passing through the center of the interior compartment. (b) The bar graph illustrates the mass fraction of air that reaches the passenger from the driver. Standard deviation of the concentration field around the passenger is represented by the error bars. (c) The heatmaps displaying the concentration field of the species originating from the driver for various window situations. The line segment A–D is at the front of the car cabin, and the flow direction in panel C is from left to right. Open windows are represented by dashed lines, whereas closed windows are represented by solid lines. C0 is the initial mass percentage of passive scalar at the injection site, with = 1. Reproduced with permission from Mathai et al., “Airflows inside passenger cars and implications for airborne disease transmission,” Sci. Adv. 7(1), eabe0166 (2021).55 Copyright 2021 American Association for the Advancement of Science.

