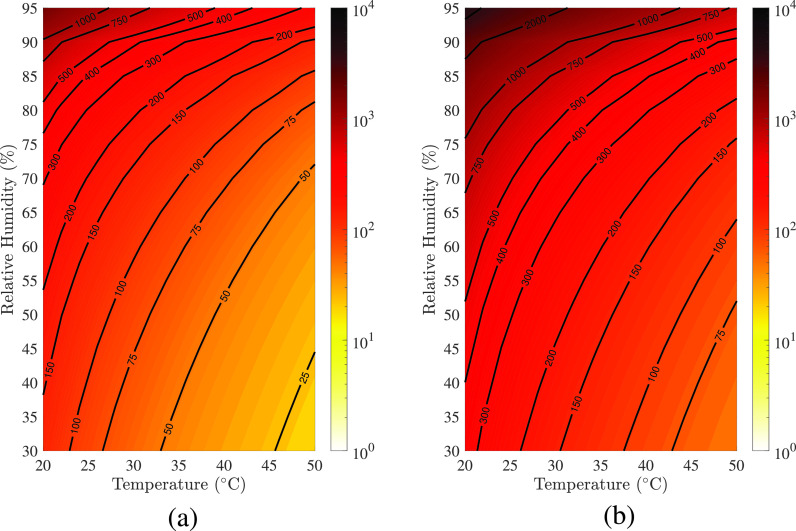
FIG. 17.
(a) Regime maps depicting the droplet's lifetime in the RH space. (a) , (b) . The colorbar represents the lifetime in second in the logarithmic scale. The rest of the parameters are nl, M = 0.154 mol/kg and . Reproduced with permission from S. Balusamy, S. Banerjee, and K. C. Sahu, “Lifetime of sessile saliva droplets in the context of SARS-CoV-2,” Int. Commun. Heat Mass Transfer 123, 105178 (2021).74 Copyright 2021 Elsevier.

