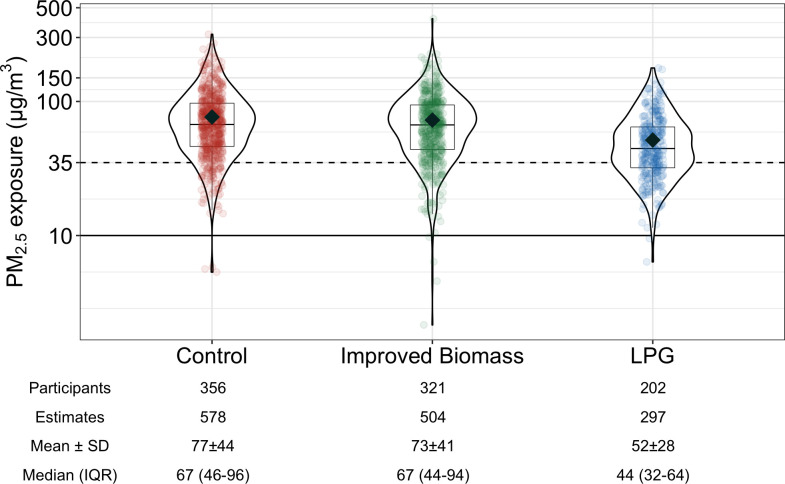
Figure 3.
The distribution of maternal personal fine particulate matter (PM2.5) exposure during the GRAPHS post-intervention period. Violin plots show the density of air pollution exposures, boxplots show the median and IQR, the mean exposure is shown with black diamonds for each study arm and partially transparent dots show all 48-hour estimates. The dotted line represents the WHO interim-1 guideline for annual PM2.5 exposure (35 μg/m3) and solid line is the WHO guideline for annual PM2.5 exposure (10 μg/m3). In the control arm, 174 women had one PM2.5 exposure estimate, 145 had two exposure estimates and 37 had three or more exposure estimates. In the improved biomass arm, 178 women had one PM2.5 exposure estimate, 106 had two exposure estimates and 37 had three or more exposure estimates. In the liquefied petroleum gas (LPG) arm, 125 women had one PM2.5 exposure estimate, 59 had two exposure estimates and 18 had three or more exposure estimates. All estimates, including multiple observations per participant, are plotted and contribute equally to summary statistics. Summary statistics ‘mean±SD’ and ‘median (IQR)’ are 48-hour PM2.5 concentration estimates with units μg/m3. GRAPHS, Ghana Randomized Air Pollution and Health Study; PM2.5, particulate matter less than 2.5 microns in diameter.

