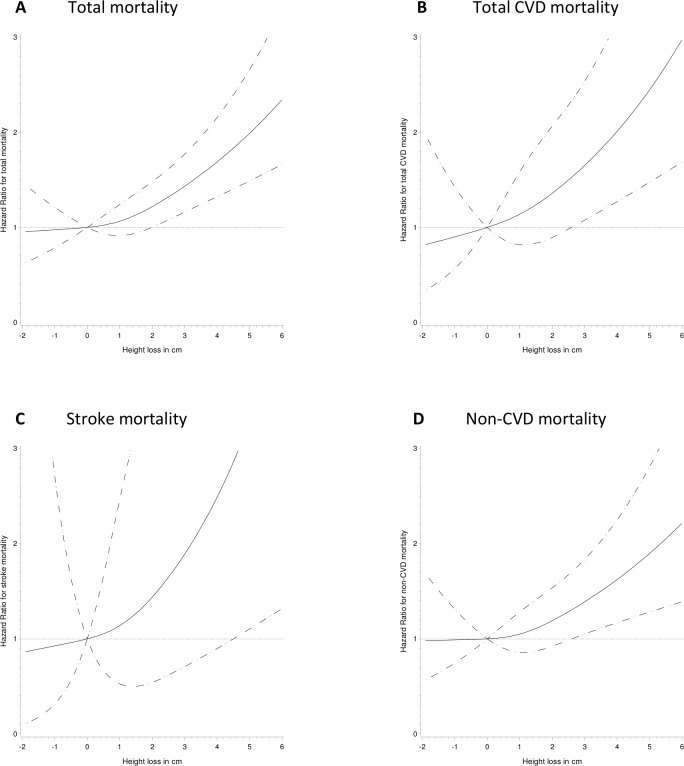
Figure 1.
Hazard ratio (HR) for 10–13 year decrease in height in relation to total mortality and cause-specific mortality in a pooled sample of Swedish and Danish women. Models were adjusted for age at follow-up, age2, time interval between height measures, height at baseline, weight at baseline, baseline smoking status, alcohol intake at baseline, baseline education, and leisure time physical activity at baseline and follow-up. Zero change in height was used as reference value for HR. Solid lines represent HR and dotted lines represent 95% CI of HR. (A) Total mortality; test for curvature p=0.3, test for overall significance of curve p=0.0001, test for linearity p<0.0001. (B) CVD mortality test for curvature p=0.7, test for overall significance of curve p=0.002, test for linearity p=0.0005. (C) Stroke mortality. Test for curvature p=0.7, test for overall significance of curve p=0.06, test for linearity p=0.02. (D) Non-CVD mortality. Test for curvature p=0.4, test for overall significance of curve p=0.01, test for linearity p=0.004.

