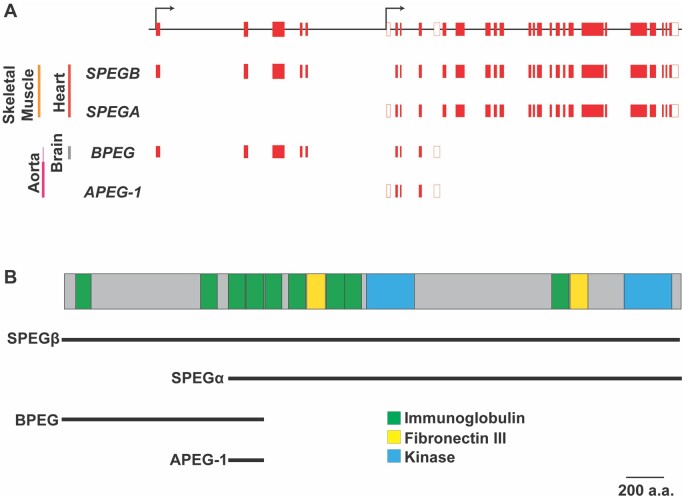
Figure 1.
Tissue-specific isoforms of SPEG and functional domains. (A) Diagram of the SPEG complex locus (top) along with the gene regions transcribed for each isoform. Black arrows mark alternative transcription start sites. Red-filled boxes are protein coding sequences/exons. Clear boxes code untranslated regions. Tissue-specific transcripts with exons/sequences included are indicated below the gene diagram. Adult tissues expressing high levels of the transcripts are indicated to the left. (B) Diagram of full-length canonical SPEG protein showing key domains including immunoglobulin, fibronectin III and kinase domains. The lines below the diagram indicate which domains are part of the four SPEG isoforms (SPEGβ, SPEGα, APEG-1, and BPEG) marked below. Scale bar of 200 amino acids (a.a.).

