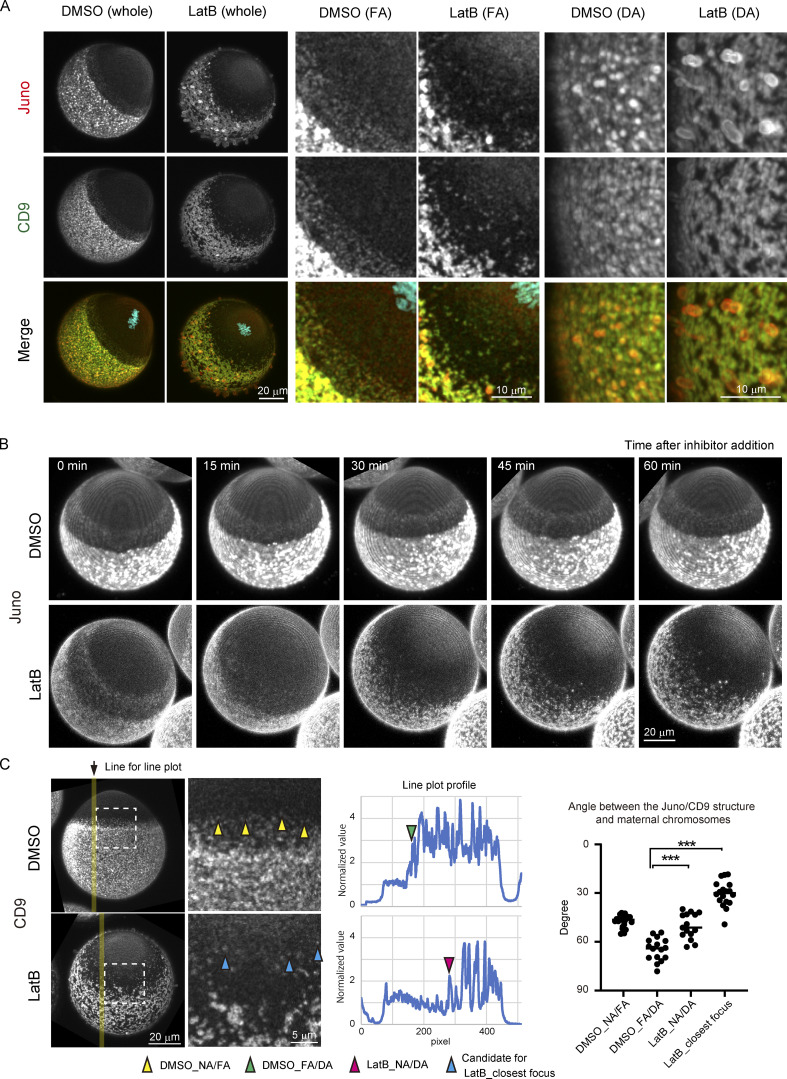
Figure 4.
F-actin contributes to but is not solely responsible for blocking the formation of Juno/CD9 structures around maternal chromosomes. (A) Immunofluorescence images of Juno and CD9 following treatment with DMSO or LatB at low magnification (whole) and high magnification (FA and DA). In LatB-treated eggs, the localization of Juno and CD9 remains overall polarized on the egg surface (whole). The FA/NA and DA/FA borders of Juno/CD9 structures become less clear in LatB-treated eggs (FA). Bleb-like long membrane protrusions containing strong Juno signals are observed in eggs treated with LatB (DA). The zona pellucida was removed (A–C). (B) Live imaging of Juno structures with a fluorescent-labeled Juno primary antibody in DMSO- or LatB-treated eggs. Juno structures in the FA region are disrupted rapidly, and Juno structures in the DA region are transferred into spot-like structures or new spot-like structures are formed de novo in the former FA region. Time-lapse video is shown in Video 5. (C) Angle between Juno/CD9 structures and maternal chromosomes after LatB treatment. The FA/DA borders in DMSO-treated eggs, and the NA/DA border in LatB-treated eggs, were determined as follows. We plotted the intensity of CD9 along a line on the maximum z-projection of image (yellow line), and the resultant plot (shown as Line plot profile) was used to acquire the position of local intensity increase (plot profile). The position was used to calculate the angle with the center of the egg in 3D. We acquired such angles from three lines per one oocyte and averaged them. For DMSO_NA/FA and LatB_closest focus, low-intensity foci of Juno/CD9 structure were manually selected (yellow and blue arrowhead). Welch’s t test was used to obtain the P value (P values between DMSO_DA and LatB_DA or LatB closest are both <0.001). ***, P < 0.001.

