Figure S1.
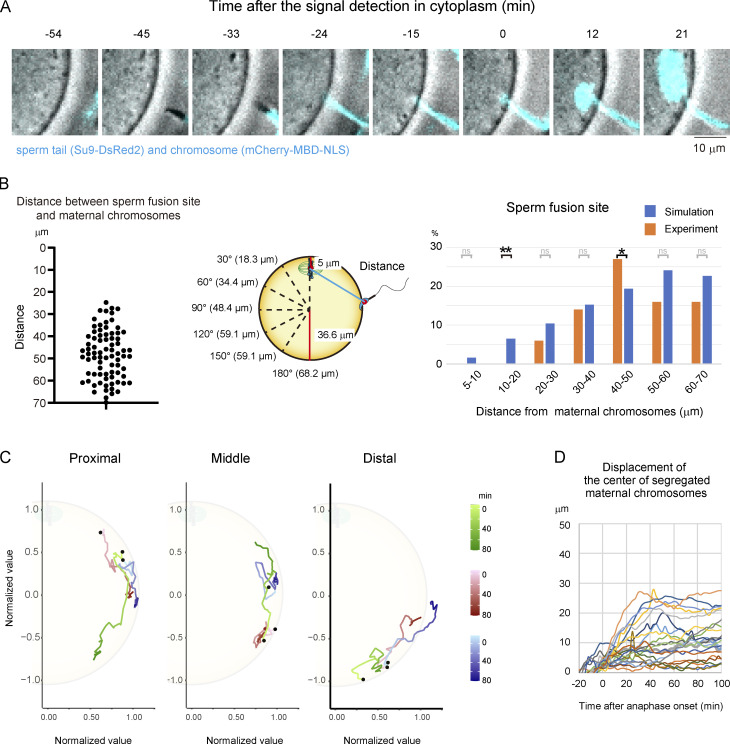
Tracking analysis of chromosomes during the fertilization process. (A) MBD showing where sperm fuse. The mCherry-MBD-NLS signal appears where the sperm tail (Su9-DsRed2) is bound. Time is relative to the sperm binding to the egg. A time-lapse video is shown in Video 1. The zona pellucida was softened by treatment with glutathione (A–D). (B) Distance between maternal chromosomes and sperm fusion sites. Left: Experimental data. Middle: Parameters for the simulation in which sperm fuse randomly on the egg surface. Right; Comparison between experimental and simulation data. Fisher’s exact tests were used to obtain P values, and Holm correction was used for the correction of multiple comparisons (P value of 10–20 µm is 8.3 × 10⁻³; P value of 40–50 µm is 4.0 × 10⁻²; P values of other areas are >0.05 [ns]). (C) Examples of trajectory in Fig. 1 C are shown in three areas (proximal, middle, and distal from maternal chromosomes). Black dots show the position of sperm fusion. The values of the position of chromosomes were normalized by the length between the sperm fusion site and the center of the egg. (D) Displacement of maternal chromosomes from the initial position when sperm fuse. *, P < 0.05; **, P < 0.01.

