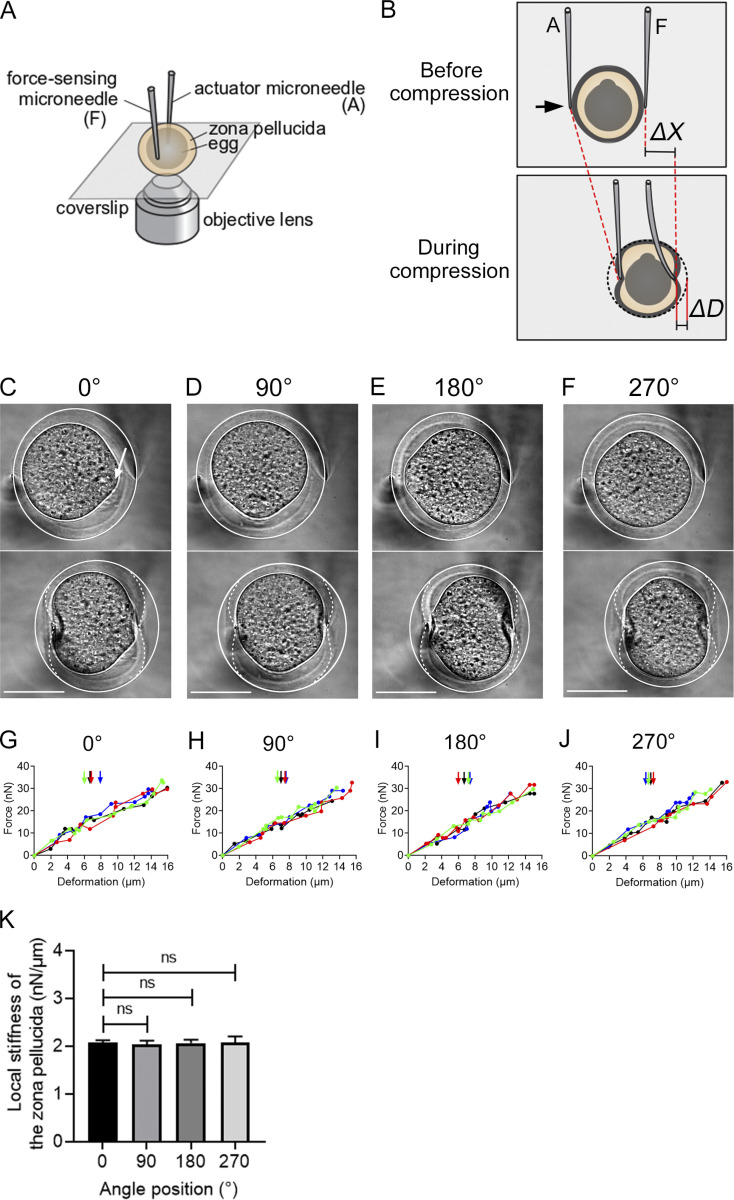
Figure S3.
Mechanical uniformity of the zona pellucida of unfertilized mouse eggs. (A and B) Schematic illustration showing the microneedle-based setup used to examine the local mechanical properties of the zona pellucida. The setup consists of two glass microneedles whose motion can be controlled using hydraulic micromanipulators such that unfertilized mouse eggs surrounded by the zona pellucida are captured and subjected to a localized force (A). The force can be applied by moving the actuator microneedle in the indicated direction (black arrow, B). The amount of force can be monitored based on the deflection of the force-sensing tip of the microneedle from its equilibrium point (ΔX). The extent of deformation (ΔD), which predominantly arises around the area to which the tips of the microneedles are attached, can be measured by analyzing the local shape change of the zona pellucida (B). (C–J) Typical bright-field images (C–F) and force–deformation relationships (G–J) obtained from the measurements. The local stiffness of the zona pellucida was measured by attaching the force-sensing tip of the microneedle at the following four cardinal points: the points most proximal and distal to the egg’s protruding cortex (white arrow; defined as 0 and 180°, respectively) and the points that were orthogonal to the 0–180° axis (defined as 90 and 270°). At each point of interest, the zona pellucida was deformed by applying cycles of compressive force with varying magnitudes, from which the force–deformation relationship was obtained (G–J). The egg was then rotated by 90° horizontal to the imaging plane to proceed in measuring the next cardinal point. The egg cell started to deform when the zona pellucida was compressed to a large extent (vertical arrows). However, the force–deformation relationship did not change significantly above that point, indicating that the contribution of the egg cell to the measured mechanics was minor. A total of n = 4 samples were examined (plotted in different colors in G–J). White solid and dotted lines in C–F highlight outlines of the zona pellucida before (upper panels) and during (lower panels) compression, respectively. At each compression, the deformation developed on both sides of the zona pellucida; the difference in the extent of deformation was 2.2 ± 6.3% (mean ± SD, n = 201 trials from 4 samples). Scale bars, 50 µm. (K) The local stiffness of the zona pellucida measured at the indicated cardinal points relative to the protruding cortex (0°). The stiffness value at each point was determined by performing linear regression in G–J for individual samples and was then averaged (2.03 ± 0.05, 2.05 ± 0.09, 2.05 ± 0.07, and 2.05 ± 0.15 nN/µm; mean ± SD, n = 4). ns, P > 0.37 by Student’s t test.

