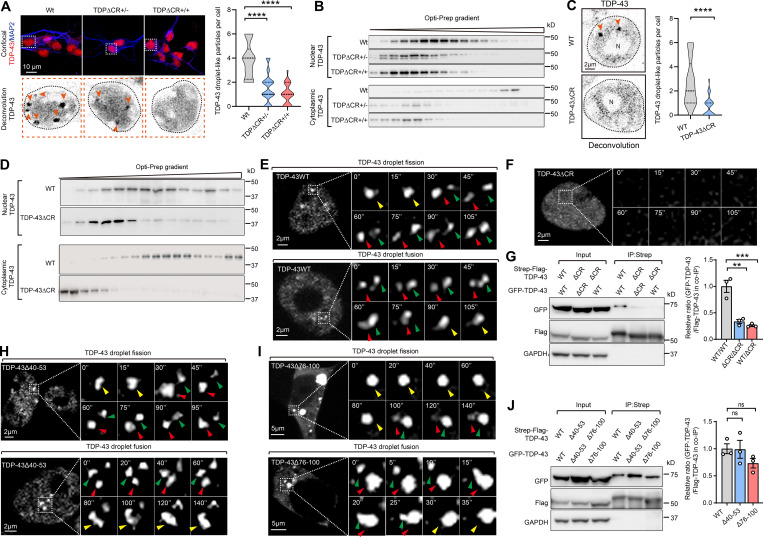
Figure 4.
Loss of CR causes abnormalities of TDP-43 LLPS. (A) Representative images and quantification of TDP-43 droplet-like particles in neurons from WT, TDPΔCR+/−, and TDPΔCR+/+ mice. Endogenous TDP-43 (red) and MAP2 (red) are shown. Lower panels, TDP-43 only (inverted in gray). Droplet-like particles are labeled by arrowheads. Cell nuclei are circled. (B) Representative immunoblot of nuclear and cytoplasmic TDP-43 from WT, TDPΔCR+/−, and TDPΔCR+/+ mouse brains separated by OptiPrep gradient ultracentrifugation. (C) Representative images and quantification of TDP-43 droplet-like particles in WT and TDP-43ΔCR HEK293 cells. TDP-43 droplet-like particles are labeled by arrowheads. (D) Representative immunoblot of nuclear and cytoplasmic TDP-43 from WT and TDP-43ΔCR HEK293 cells. (E and F) Representative images of dynamic changes of TDP-43 droplet-like particles in the nucleus of HEK293 cells expressing GFP-tagged TDP-43WT (E) or TDP-43ΔCR (F). Higher-magnification images at different time points are shown in the right panels. Green and red arrowheads point to two separate droplets before fusion, and yellow arrowheads point to the fused droplets. Note that TDP-43 is diffusive, and no droplet is noted in cells expressing TDP-43ΔCR. N, nuclear. (G) Representative immunoblot of coIP between transfected Strep-Flag–tagged TDP-43 (WT and ΔCR) and GFP-tagged TDP-43 (WT and ΔCR) in HEK293 cells. (H and I) Representative images of dynamic changes of TDP-43 droplet-like particles in the nucleus of HEK293 cells expressing GFP-tagged TDP-43Δ40-53 (G) and TDP-43Δ76-100 (H). Higher-magnification images at different time points are shown in the right panels. Green and red arrowheads point to two separate droplets before fusion, and yellow arrowheads point to the fused droplets. N, nuclear. (J) Representative immunoblot of coIP between transfected Strep-Flag–tagged TDP-43 (WT, Δ40-53, and Δ40-53) and GFP-tagged TDP-43 (WT, Δ40-53, and Δ40-53) in HEK293 cells. Data are mean ± SEM; one-way ANOVA followed by Tukey’s multiple comparisons test (A, G, and J), two-tailed Student’s t test (C). **, P < 0.01; ***, P < 0.001; and ****, P < 0.0001.

