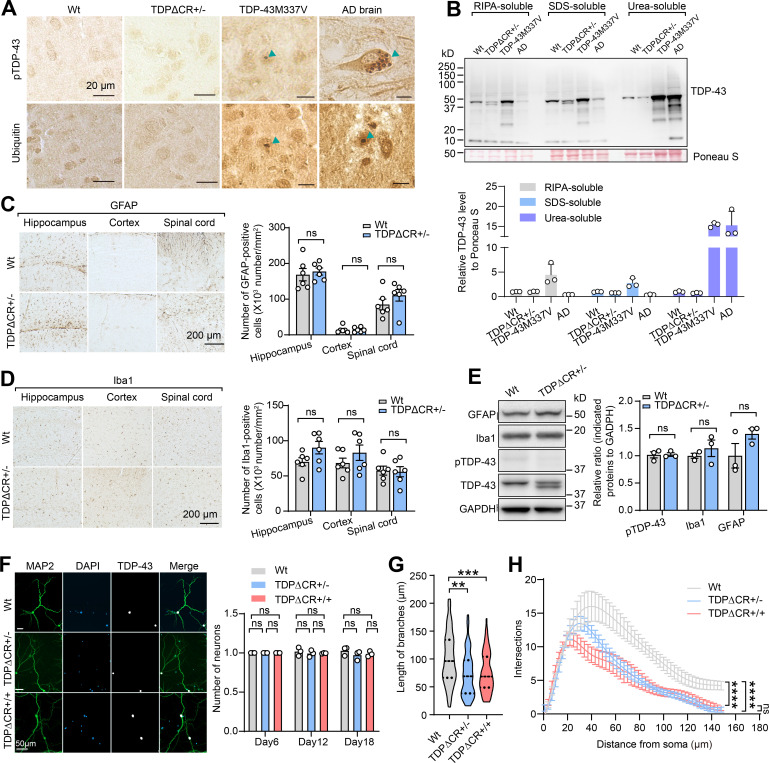
Figure S2.
Absence of TDP-43 proteinopathy or neurodegeneration in TDPΔCR mice. (A) Representative immunohistochemistry of phosphorylated TDP-43 (pTDP-43) and ubiquitin in the brains of WT, TDPΔCR+/−, and TDP-43M337V mice at 3 mo old and in Alzheimer’s disease (AD) brains. (B) Representative immunoblot analysis of TDP-43 in SDS and urea soluble fraction from brain tissues of 3-mo-old WT or TDPΔCR+/− mice. Ponceau S staining was used for the loading control. (C and D) Representative immunohistochemistry and quantification of Iba1 (C) and glial fibrillary acidic protein (GFAP; D) in the hippocampus, cortex, and spinal cord of 3-mo-old WT and TDPΔCR+/− mice (n = 6 mice per group). (E) Representative immunoblot and quantification of Iba1, GFAP, pTDP-43, and TDP-43 in the brain lysates of WT and TDPΔCR+/− mice (n = 3 mice per group). GAPDH is included as the internal control. (F) Representative images of TDP-43 and MAP2 in primary cultured neurons from WT, TDPΔCR+/−, and TDPΔCR+/+ mice. Right: Quantification of neuronal cell numbers from WT, TDPΔCR+/−, and TDPΔCR+/+ mice. (G) Quantification of cultured hippocampal neurons from WT, TDPΔCR+/−, and TDPΔCR+/+ mice (n = 8–10 neurons per genotype). (H) Sholl analysis of cultured hippocampal neurons from WT, TDPΔCR+/−, and TDPΔCR+/+ mice (n = 8–10 neurons per genotype). Data are mean ± SEM; two-tailed Student’s t test (C–E), one-way ANOVA followed by Tukey’s multiple comparisons test (F and G), two-way ANOVA followed by Bonferroni multiple comparisons test (H). **, P < 0.01; ***, P < 0.001; ****, P < 0.0001.

