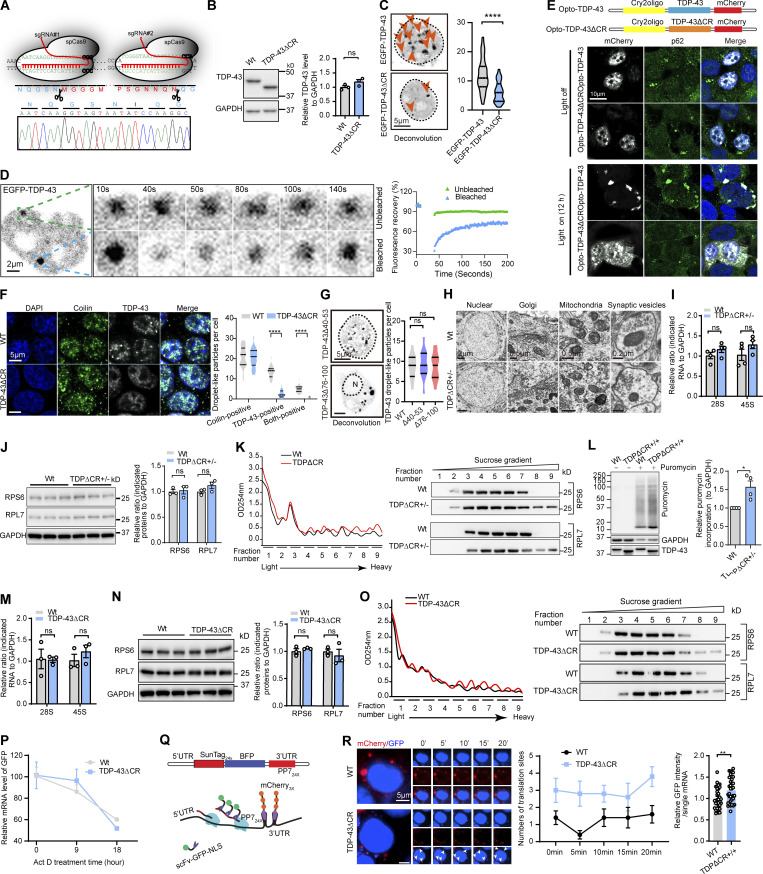
Figure S3.
Validation of LLPS loss by the deletion of the CR motif in TDP-43ΔCR cells and increased ribosomal assembly and protein translation in TDPΔCR mice and TDP-43ΔCR cells. (A) Schematic diagram of CRISPR/Cas9 genome editing of the TARDBP gene in HEK293 cells to obtain cells with deletion of the CR in human TDP-43 (TDP-43ΔCR cells). sgRNA, single-guide RNA. (B) Representative immunoblotting and quantification of TDP-43 in TDP-43ΔCR cells. GAPDH is used as the internal control. (C) Representative images and quantification of TDP-43 droplet-like particles formed in the nucleus of HEK293 cells expressing GFP-tagged TDP-43WT and TDP-43ΔCR. Cell nuclei are circled. (D) FRAP of GFP-tagged TDP-43 droplets in HEK293 cells after 24 h of expression. Higher magnification is shown in the right panel. The whole droplet was photobleached for 40 s. Mean fluorescence intensity at the bleached area was plotted over time, normalized to the average intensity of a droplet before photobleaching, and represented as the mean (from the recovery curves of five bleached droplets and four unbleached droplets). (E) optoTDP43 fusion protein and representative immunofluorescence images of optoTDP-43, optoTDP-43ΔCR, and p62 exposed to blue light stimulation (bottom) or darkness (top). (F) Representative immunofluorescence images and quantification of coilin and TDP-43 droplet-like particles in WT and TDP-43ΔCR HEK293 cells. (G) Representative images and quantification of TDP-43 droplet-like particles in the nucleus or cytoplasm of HEK293 cells expressing GFP-tagged TDP-43Δ40-53 or TDP-43Δ76-100, respectively. N, nuclear. Cell nuclei are circled. (H) EM analysis of nuclear, Golgi, mitochondrial, and synaptic vesicles in hippocampal neurons of 3-mo-old WT and TDPΔCR+/− mice. (I) Relative 28S and 45S ribosomal RNA levels in the brains of 3-mo-old WT and TDPΔCR+/− mice (n = 4 mice per group). Data were normalized to GAPDH. (J) Representative immunoblotting and quantification of RPS6 and RPL7 in the brain lysates of WT and TDPΔCR+/− mice (n = 3 mice per group). GAPDH is included as the internal control. (K) Representative immunoblots of RPS6 and RPL7 in the brains of WT and TDPΔCR+/− mice separated by sucrose gradient ultracentrifugation. UV absorbance profile at 254 nm of the extract from 3-mo-old WT and TDPΔCR+/− mice is shown at left. (L) Representative immunoblotting and quantification of newly synthesized polypeptide labeled by puromycin (10 µg/ml for 15 min) in primary cultured neurons from WT and TDPΔ+/+ mice at day in vitro 7. GAPDH was used as the internal control. (M) Relative 28S and 45S ribosomal RNA levels in WT and TDP-43ΔCR HEK293 cells. Data were normalized to GAPDH. (N) Representative immunoblotting and quantification of RPS6 and RPL7 in the cell lysates of WT and TDP-43ΔCR HEK293 cells. GAPDH was included as the internal control. (O) Representative immunoblots of RPS6 and RPL7 in WT and TDP-43ΔCR HEK293 cells separated by sucrose gradient ultracentrifugation. UV absorbance profile at 254 nm of the extract from WT and TDP-43ΔCR HEK293 cells is shown at left. (P) Relative level of the GFP mRNA in WT and TDP-43ΔCR HEK293 cells transfected with CMV-GFP plasmid. Cells were treated with 10 µM actinomycin D (Act D) for 0–18 h and then harvested at the time points indicated, followed by RNA isolation and RT-qPCR analysis. All the data were normalized to the GFP mRNA level before treatment. (Q) Schematic of nascent polypeptide labeling using the SunTag system and mRNA labeling using the PP7 system. (R) WT or TDP-43ΔCR cells expressing the SunTag24x-BFP-PP724x reporter was imaged by time-lapse microscopy. Active translation sites were quantified over time (n = 5 cells). Asterisks indicated active translation sites. Intensity of scFv-GFP at translational sites was measured in both WT and TDP-43ΔCR cells (n = 32–35 translation sites from 6–8 cells). Data are mean ± SEM; one-way ANOVA followed by Tukey’s multiple comparisons test (G) or two-tailed Student’s t test (B, C, F, I, J, L–N, and R). *, P < 0.05; **, P < 0.01; ****, P < 0.0001.

