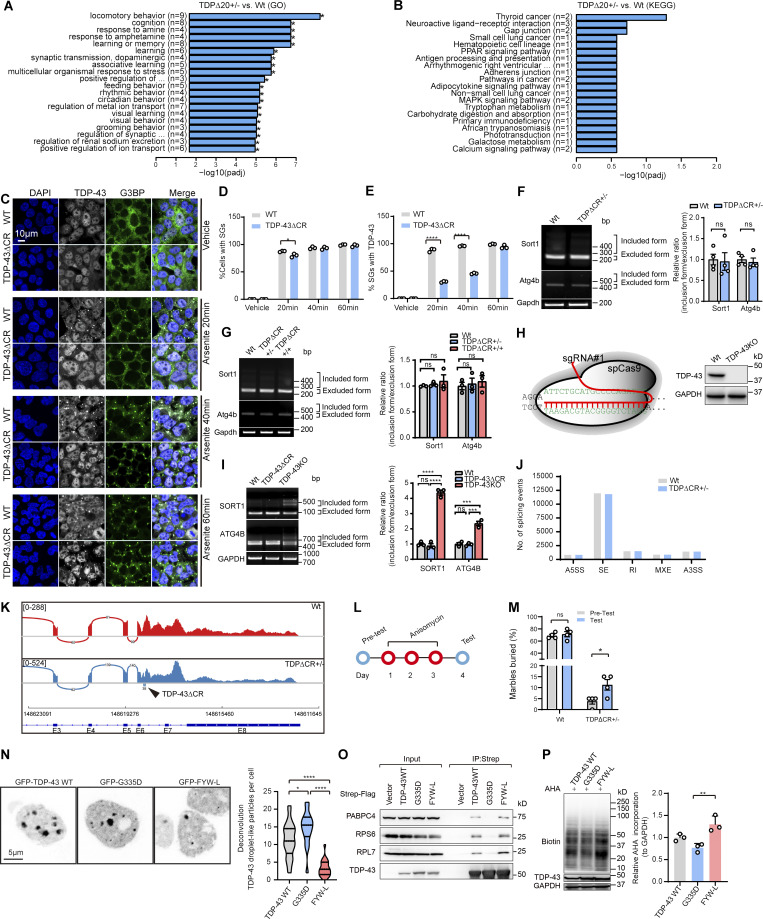
Figure S5.
CR loss has no effect on RNA splicing activity and stress granule (SG) recruitment of TDP-43 and the effects of mutations of TDP-43 on protein translation. (A) Gene ontology (GO) enrichment analysis of altered expression of genes in RNA-seq data analysis. (B) Kyoto Encyclopedia of Genes and Genomes (KEGG) analysis of altered expression of genes in RNA-seq data analysis (n = 3 mice per group). (C) Representative immunofluorescence images of TDP-43 (white) and G3BP1 (green) in WT and TDP-43ΔCR HEK293 cells treated with sodium arsenite (500 µM) for the indicated times. DAPI was used to visualize nuclei. PPAR, peroxisome proliferator-activated receptor. (D and E) Quantification of SG-positive cells and TDP-43–positive SGs in WT and TDP-43ΔCR cells treated with sodium arsenite. n = 100–200 cells per group. (F) RT-PCR assay of Sort1 and Atg4b splicing in the brains of 3-mo-old WT and TDPΔCR mice (n = 4 per group). (G) RT-PCR assay of Sort1 and Atg4b splicing in the brains of newborn WT, TDPΔCR+/−, and TDPΔCR+/+ mice (n = 3 per group). (H) Schematic diagram of CRISPR/Cas9 genome editing of the TARDBP gene in HEK293 cells to obtain cells with the deletion of human TDP-43 (TDPKO cells). sgRNA, single-guide RNA. (I) RT-PCR assay of SORT1 and ATG4B splicing in WT, TDP-43ΔCR, and TDP-43KO HEK293 cells. (J) Classification of alternative splicing events in WT and TDPΔCR+/− mice (n = 3 mice per group). A3SS, alternative 3′ splice site; A5SS, alternative 5′ splice site; MXE, mutually exclusive exons; RI, retained intron; events; SE, skipped exon. (K) Sashimi plots of Tardbp in WT and TDPΔCR+/− mouse brains. Arrowhead indicates the deletion of 60 nt coding 321–340 aa of TDP-43 in TDPΔCR+/− mice (n = 3 per group). (L) Schematic of anisomycin treatment in 3–4-mo-old WT and TDPΔCR+/− mice. (M) Quantification of the marble-burying activity of WT and TDPΔCR+/− mice before and after anisomycin treatment (10 mg/kg; n = 4 mice per group). (N) Representative images and quantification of TDP-43 droplet-like particles formed in the nucleus of HEK293 cells expressing GFP-tagged TDP-43WT, G335D, or FYW-L. (O) Representative immunoblot of coIP between exogenously expressed Strep-Flag–tagged TDP-43 WT, G335D, and FYW-L and endogenous PABPC4, RPS6, and RPL7 in HEK293 cells. (P) Representative immunoblot and quantification of newly synthesized proteins labeled by Click-iT AHA in TDP-43–knockout HEK293 cells expressing TDP-43WT, G335D, or FYW-L. Data are mean ± SEM; one-way ANOVA followed by Tukey’s multiple comparisons test (J, I, N, and P) and two-tailed Student’s t test (D, E, F, and M). *, P < 0.05; **, P < 0.01; and ****, P < 0.0001.

