Figure 6.
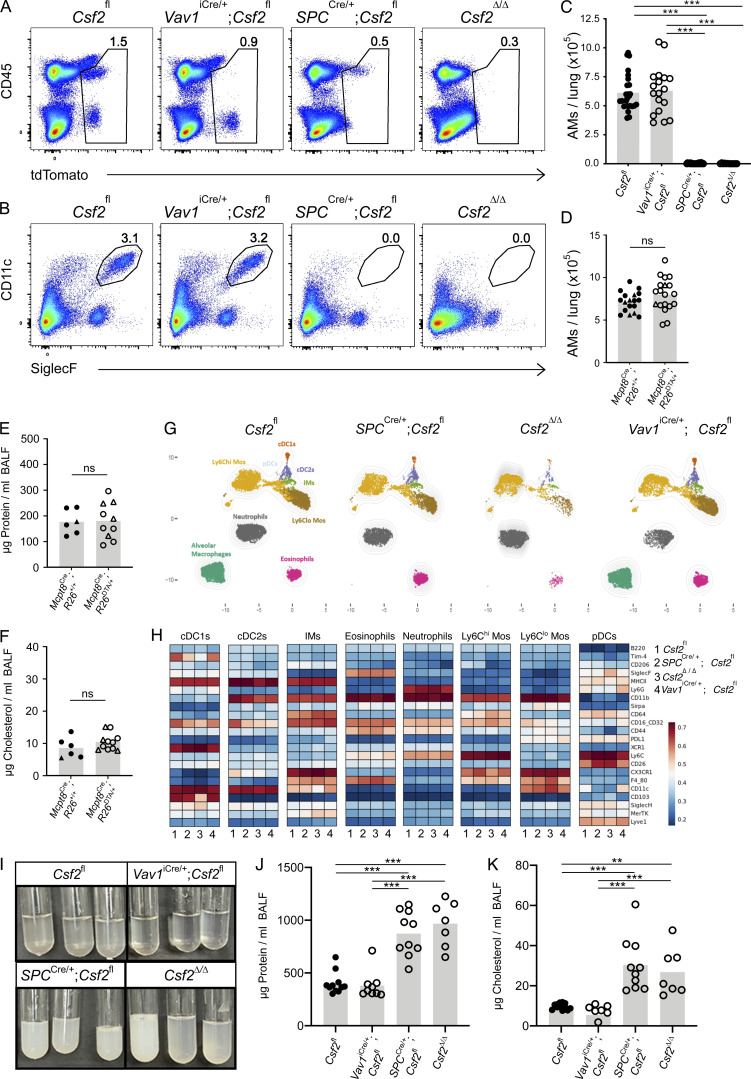
AT2-specific deletion of Csf2 leads to AM depletion in adult lungs. (A–C, G, and H) Analysis of adult lungs isolated from Csf2fl, Vav1iCre/+;Csf2fl, SPCCre/+;Csf2fl, and Csf2Δ/Δ mice. (A) Flow cytometry analysis of tdTomato+ populations. (B) Flow cytometry analysis of CD11c+SiglecF+ AMs, gated on live CD45+Ly-6G− cells. (C) Quantification of AMs. (D) Quantification of AMs (CD45+SiglecF+CD11c+) in adult lungs of Mcpt8YFP-Cre;R26+/+ and Mcpt8YFP-Cre;R26DTA/+ mice. Mcpt8YFP-Cre/+ mice are indicated by circles, while Mcpt8YFP-Cre/YFP-Cre mice are indicated by triangles. (E) Quantification of protein in BALF from mice as in D. (F) Quantification of total cholesterol in BALF from mice as in D. (G) A representative UMAP map showing the FlowSOM-guided meta-clustering of the myeloid compartment. Mos, monocytes; IMs, interstitial macrophages; cDC, conventional DC; and pDC, plasmacytoid DC. (H) Heatmap displaying the median antigen intensity of markers used to generate G. (I) BALF from adult Csf2fl, Vav1iCre/+;Csf2fl, SPCCre/+;Csf2fl, and Csf2Δ/Δ mice. (J) Quantification of protein in BALF as in I. (K) Quantification of total cholesterol in BALF as in I. (A, B, and G–I) Data are from one experiment representative of four (A, B) or two (G–I) independent experiments. (C–F, J, and K) Data are pooled from four (C), three (D), or two (E, F, J, and K) independent experiments. ns, P ≥ 0.05; **, P 0.01–0.001; ***, P 0.0001–0.001.

