Figure 3.
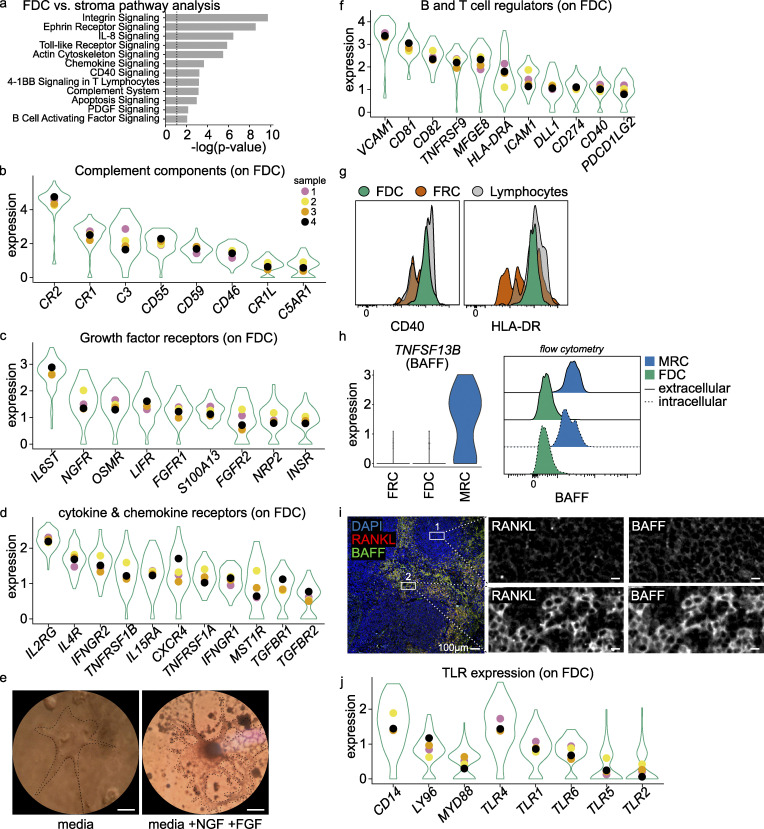
FDC key pathways. (a) Ingenuity pathway analysis was performed on differential expressed genes of the FDC dataset compared with the FRC and MRC datasets. The most significant pathways are listed. (b–d, f, and h) Most expressed pathway gene expression in FDCs. Violin plot is aggregate data, and colored dots are mean value per donor. All genes were above expression threshold. (e) Micrograph of sorted FDCs after 7-d culture in media with NGF and FGF. Scale bar, 10 µm. (g) CD40 and HLA-DR fresh protein expression on FDCs compared with FRCs and lymphocytes. (i) BAFF expression in FDCs, FRCs, and MRCs by scRNaseq and BAFF protein expression in FDCs and MRCs by flow cytometry. Intra- and extracellular staining. (j) Immune fluorescent image of tonsil section. Scale bar, 100 µm. Box 1 is central to the FDC area, and box 2 MRCs are stained by RANKL. Scale bar, boxes, 10 µm. scRNaseq data, n = 4 (biological replicates), Sctransform-normalized expression. Related to Fig. S3 and Fig. S4 a.

