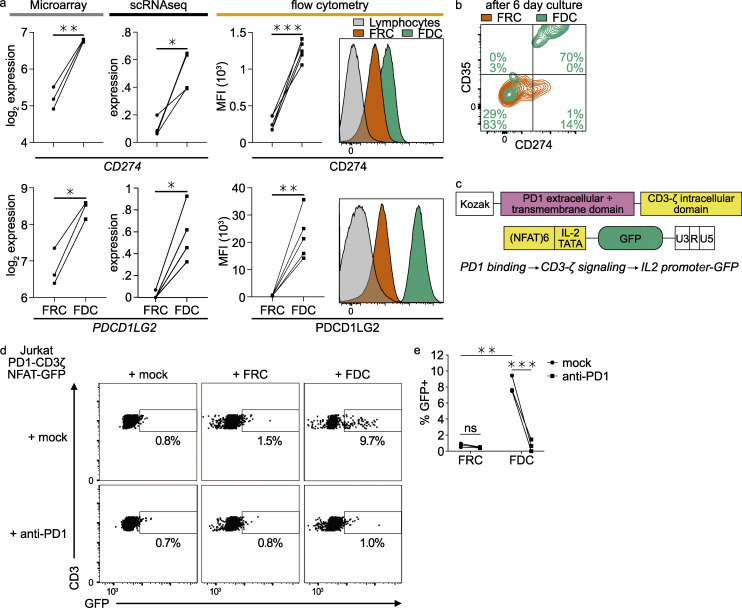
Figure 5.
FDCs express functional PD1 ligands. (a) PD-L1 (CD274) and PD-L2 (PDCD1LG2) gene expression by microarray and scRNaseq and protein expression by flow cytometry. Sctransform-normalized expression. (b) Sorted FDCs and FRCs were cultured for 6 d, trypsinized, and analyzed for surface protein expression of CD274 and CD35 by flow cytometry. (c) PD1-CD3ζ NFAT-GFP reporter constructs. PD1 activation on the T cell will lead to expression of GFP. GFP, enhanced GFP. (d) GFP signal of PD1-CD3ζ NFAT-GFP reporter Jurkat cell line with and without Nivolumab (anti-PD1) after co-culture with FDCs or FRCs. (e) Quantification of PD1-CD3ζ NFAT-GFP reporter Jurkat cell line co-culture with FDCs or FRCs. Student’s t test or ANOVA, *, P > 0.05; **, P > 0.01; ***, P > 0.001; scRNaseq data, n = 4; microarray data, n = 3; flow cytometry, n = 5; Jurkat reporter data, n = 3 (biological replicates). Related to Fig. S5.

