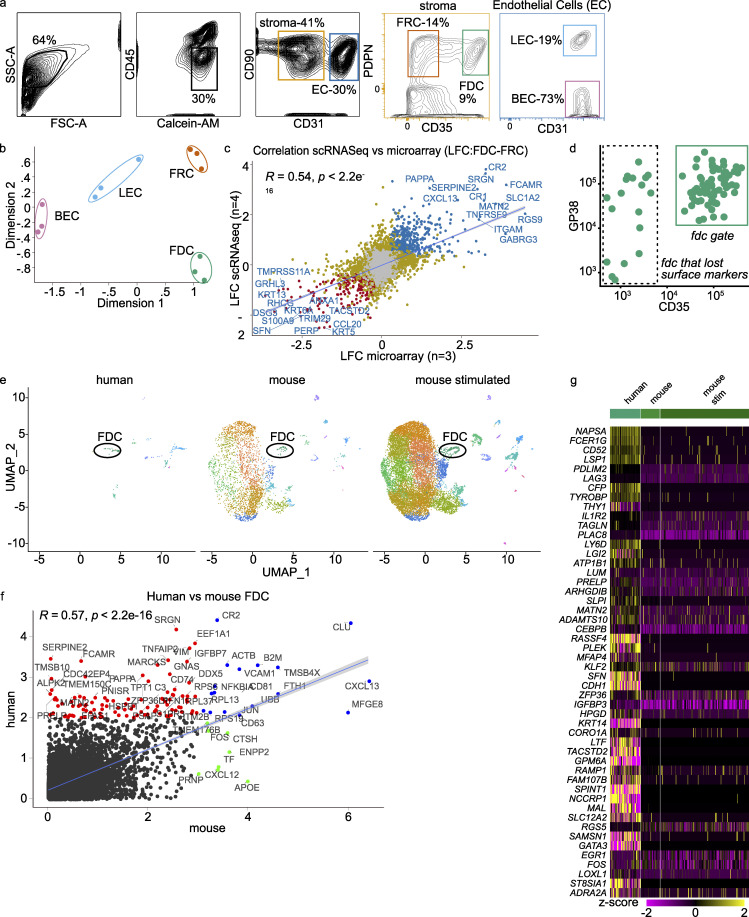
Figure S1.
scRNaseq, microarray, and scRNaseq mouse transcriptome data correlate well. (a) Gating strategy for microarray. CD45−, live cells were gated for stroma and endothelial cells. Within the stroma gate, a gate for FRCs (PDPN+CD35−) and FDCs (PDPN+CD35+) was set, while in the endothelial gate, lymph endothelial cells (LECs; PDPN+CD31+) and blood endothelial cells (BECs; PDPN-CD31+) were defined. (b) Multi-Dimensional Scaling plot shows clustering of the microarray samples. Dimensions 1 and 2 account for 74.1% and 12.3% of variance, respectively. (c) Correlation of log fold change of FDCs versus FRCs between scRNaseq and microarray. Top genes were labeled. (d) FACS plot on FDC cluster through index sort. Most cells from the FDC cluster fall within the FDC gate. Minimal cleavage of extracellular markers by digestive enzymes. GP38 (PDPN) versus CD35 (CR1). (e) Uniform Manifold Approximation and Projection (UMAP) clustering of integrated datasets after conversion of mouse genes to human orthologues (one-on-one) and discarding nonmatching genes. FDC cluster is indicated. Mouse scRNaseq data from Rodda et al. (2018) (GEO accession no. GSE112903). (f) Mean expression of human versus mouse FDCs. Genes with no expression in either dataset were ignored. Red indicates top genes expressed more in human, blue indicates top genes in agreement, and green indicates top genes expressed more in mouse. (g) Top 50 most differentially expressed genes mouse versus human. scRNaseq violin plot on major clusters. scRNaseq data, n = 4; microarray data n = 3 (biological replicates). FSC-A, forward scatter area; SSC-A, side scatter area; stim, stimulated.

