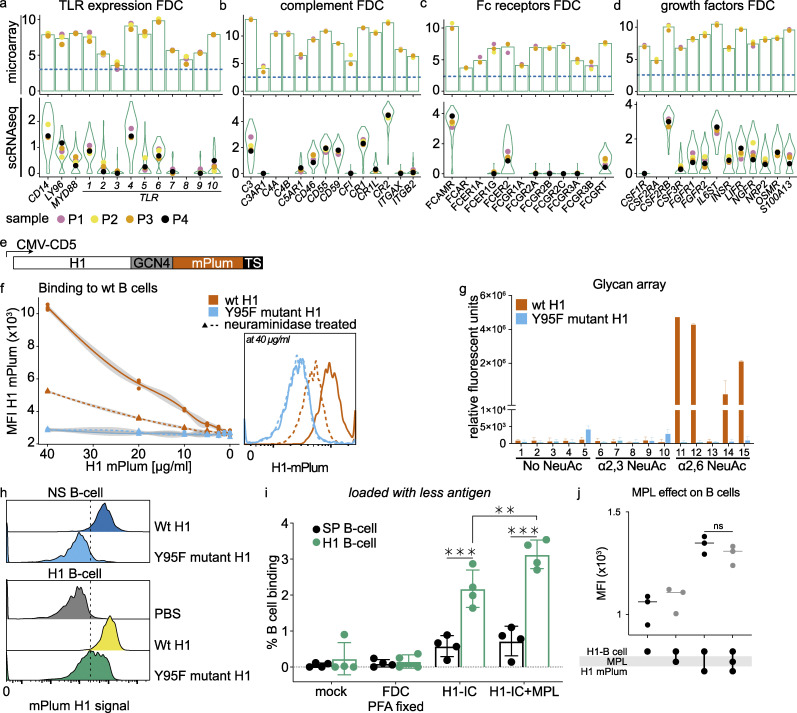
Figure S4.
FDC genes microarray and hemagglutinin controls. (a) Expression of TLRs on FDCs by microarray and scRNaseq. n = 3 and n = 4, respectively (biological replicates). Bars represent average expression, and violin plots aggregate all cells. Colored dots indicate (average) expression of donors. (b) As in (a) for complement components. (c) As in (a) for Fc receptors. (d) As in (a) for growth factors. (e) Glycoprotein expression plasmid with GCN4 trimerization motif with C-terminal mPlum. Schematic representation of used expression system with CMV promoter. The H1 open reading frame was cloned in frame with the CD5 signal peptide, followed by a GCN4 trimerization motif, mPlum, and a TEV cleavable twin-strep-tag at its C terminus. (f) Binding of H1-mPlum to WT B cells (Raji), which express α2,6 NeuAc. MFI of mPlum on B cells was measured at different concentrations of H1-mPlum. Binding is neuraminidase-sensitive and dose-dependent; the Y95F mutant does not bind. Flow cytometry histogram is shown at the highest concentration (40 µg/ml H1-mPlum). (g) Glycan array, WT H1-mPlum (PR8) binds to α2,6 NeuAc moieties while the Y95F H1-mPlum mutant (PR8) does not. Exact composition of glycans can be found in Table 1. (h) Y95F mutant binding to specific (H1 B cell) and NS-B cells (S. pneumoniae–specific) compared with WT H1 binding. Residual binding on NS-B cells disappears with the mutant. (i) Percentage H1-mPlum–positive B cells after incubation with FDCs loaded with 100-fold less H1-IC as in Fig. 4; n = 4 (biological replicates). H1-B cell (influenza H1–specific) and SP-B cell (S. pneumoniae–specific). MPL (TLR4 agonist). (j) Effect of MPL on H1-mPlum binding capability of H1–B cells. B cells were incubated with 100 ng/ml MPL, and H1-mPlum was added. No difference in binding was reported. n = 3 (biological replicates). Student’s t test or ANOVA, **, P > 0.01; ***, P > 0.001. Related to Table 1. TS, thymidylate synthase promotor.

